Differences between MicroProfile 6.0 and 5.0
MicroProfile 6.0 is a major release. It includes Jakarta EE 10 Core Profile and replaces MicroProfile OpenTracing with MicroProfile Telemetry.
Therefore, MicroProfile OpenTracing moves out of the umbrella release and becomes a stand-alone specification. For more information about Jakarta EE 10 Core Profile, see the Core Profile specification.
If you are updating your application from using MicroProfile 5.0 features to using MicroProfile 6.0 features, changes in API behavior might require you to update your application code. The following sections provide details about migrating your applications from MicroProfile 5.0 to 6.0:
Differences between MicroProfile OpenAPI 3.1 and 3.0
The MicroProfile OpenAPI 3.1 release introduces support for enhancing generated schemas by using information from Jakarta Validation annotations. If you don’t want this function, you can disable it by setting the mp.openapi.scan.beanvalidation MicroProfile Config property to false. This property can be set in any of the configuration sources that are available to MicroProfile Config. For more information, see Jakarta Validation Annotations in the MicroProfile OpenAPI 3.1 specification.
Differences between MicroProfile JSON Web Token 2.1 and 2.0
The MicroProfile JSON Web Token 2.1 introduces several new MicroProfile Config properties. For more information, see MicroProfile Config properties: MicroProfile JSON Web Token.
Differences between MicroProfile Metrics 5.0 and 4.0
The MicroProfile Metrics 5.0 release introduces many changes to the specification and programming model that impact users who are migrating from MicroProfile Metrics 4.0.
SmallRye implementation of the specification
In previous versions, Open Liberty implemented the specification in its own codebase. However, starting in MicroProfile Metrics 5.0, Open Liberty consumes the SmallRye implementation of the specification to produce the mpMetrics-5.0 feature.
Removed metric types
The following metric types are removed from the MicroProfile Metrics 5.0 release:
Concurrent gauge
Simple timer
Meter
Updated Metric types
The following metric types are modified in the MicroProfile Metrics 5.0 release or have extra configuration properties from the SmallRye implementation:
Histogram
The percentile precision can be configured by using the
mp.metrics.smallrye.histogram.precisionMicroProfile Config property. The value is from 1-5. Larger values result in a higher precision for calculating the percentiles at the cost of greater memory usage. The default value is set to 3.Timer
The timer metric no longer tracks throughput in MicroProfile Metrics 5.0. The API is updated to reflect this change.
The percentile precision can be configured by using the
mp.metrics.smallrye.timer.precisionMicroProfile Config property. The value is from 1-5. A larger value results in a higher precision for calculating the percentiles at the cost of greater memory usage. The default value is set to 3.Gauge
Gauges track only numerical values in MicroProfile Metrics 5.0.
REST.Request metric
In earlier releases of MicroProfile Metrics, the
REST.Requestmetric was instrumented with aSimpleTimermetric type. Starting in MicroProfile Metrics 5.0, theSimpleTimermetric type is no longer available and the metric is now instrumented with aTimermetric type.
Metadata
Starting in MicroProfile Metrics 5.0, the metric metadata no longer supports the display name (displayName) and metric type (metricType) attributes.
User-defined Metric Registry scope
Starting in MicroProfile Metrics 5.0, in addition to the default application metric registry scope, you can define your own metric registry scope to register metrics to. For more information, see User-defined metric registry scopes.
Metric tags
In previous releases, tags could be used to instrument multiple metrics with the same name if the tags had different values. Starting in MicroProfile Metrics 5.0, the set of tag names must be identical across all metric IDs with the same metric name. For more information, see Metric tags.
- Scope and application name tags
In MicroProfile 5.0, the
_apptag that was defined in prior releases by themp.metrics.appNameMicroProfile Config property is now designated asmp_app. The metric registry scope is also identified with amp_scopetag. Both of these tags are reserved and if they are used when you instrument metrics, anIllegalArgumentExceptionoccurs.
REST endpoints
The MicroProfile Metrics 5.0 specification redefines how the metrics output in the the /metrics REST endpoint is filtered with the scope and metric parameters. In previous releases, the REST endpoint used path parameters for querying metrics of a certain scope and metric name with the following syntax /metrics/<scope>/<name>. The MicroProfile Metrics 5.0 /metrics REST endpoint uses query parameters instead, in the following syntax /metrics?scope=<scope>&name=<metric_name>.
For example, a query for base metrics uses the /metrics?scope=base REST endpoint. A query for the jvm.uptime metric in the base scope uses the /metrics?scope=base&name=jvm.uptime REST endpoint.
Metric output format
The MicroProfile Metrics 5.0 specification removes the explicit requirement for the JSON output format to be made available. The SmallRye implementation that the Open Liberty runtime is using also removed JSON output from the /metrics endpoint. The specification now only requires that Prometheus-formatted metrics be made available through the /metrics endpoint.
The Prometheus-formatted output is also updated, including the following changes.
- Metric registry scope
The Metric Registry scope that a metric is associated to was indicated with a prefix of
base_orvendor_in the Prometheus-formatted name. In MicroProfile Metrics 5.0, this information is displayed with anmp_scopetag, for example,{mp_scope="base"}.- Histogram metric
In MicroProfile Metrics 5.0, metrics that are instrumented with a
Histogrammetric type have fewer formatted outputs than in previous releases, due to the removal of themin,mean, andstddevvalues. Furthermore, the formatting of the Prometheus output is changed. The suffix that defines theHistogramvalue trails after the unit suffix. For example,bulkhead_waitingDuration_max_secondsbecomesbulkhead_waitingDuration_seconds_max.- Timer metric
Timer metrics output is similar to the histogram output; the value suffix trails after the unit suffix.
- Metric units
In earlier releases, when a metric is instrumented and a unit is defined for it, the Prometheus output is scaled to the base unit. In MicroProfile Metrics 5.0, the unit that is associated to the metric is what is reflected in the Prometheus output. Output is not scaled to a base unit.
Integration with Micrometer
The SmallRye metrics implementation, on which Open Liberty bases its mpMetrics-5.0 feature, uses Micrometer as its core metrics library. You can configure the Open Liberty runtime to send metrics to the third-party metric monitoring systems that are supported by Micrometer. For more information, see Choose your own monitoring tools with MicroProfile Metrics.
Differences between MicroProfile Telemetry 1.0 and MicroProfile OpenTracing 3.0
In MicroProfile 6.0, MicroProfile Telemetry 1.0 replaces MicroProfile OpenTracing 3.0 because the upstream OpenTracing project combined with OpenCensus to form the OpenTelemetry project.
Configuration changes
In addition to replacing the mpOpenTracing-3.0 feature with the mpTelemtry-1.0 feature in your server.xml file, you must provide configuration to allow the MicroProfile Telemetry feature to connect to your distributed trace service. For more information, see Collect logs, metrics, and traces with OpenTelemetry.
You do not need to package a client for your particular tracing service. MicroProfile Telemetry includes exporters for Zipkin, the OpenTelemetry Protocol (OTLP) (which is used by Jaeger since v1.35), and the older Jaeger protocol. If you need to export to a different service, you can provide a custom exporter by using the ConfigurableSpanExporterProvider service provider interface (SPI).
Selecting a compatible propagator
Several different standards are available to propagate span information between microservices by using HTTP headers. If you’re upgrading microservices one at a time, you must enable a propagation method that is compatible with your other microservices.
The otel.propagators configuration property configures which propagators are used. The following values are available:
tracecontext: W3C Trace Context (usually used together withbaggage)baggage: W3C Baggageb3: B3 single headerb3multi: B3 Multi headerjaeger: Jaeger
You can use these values to specify one or more propagators. The default value is tracecontext,baggage.
If more than one propagator is enabled, then all headers are added to outgoing requests and any header is accepted for incoming requests. For example, if you are migrating from using a Jaeger client, you might set otel.propagators=jaeger to use the Jaeger propagation protocol. Alternatively, you might set otel.propagators=jaeger,tracecontext,baggage to allow use of both the Jaeger and W3C protocols.
API changes
The OpenTelemetry API replaces the OpenTracing API. Although these APIs are similar, any code that used the OpenTracing API must be updated to use the OpenTelemetry API. To simplify migration, the OpenTelemetry project created the OpenTracing shim, which converts OpenTracing API calls into OpenTelemetry API calls. This shim allows applications to be migrated piece by piece rather than all at once.
The @Traced annotation
The @Traced annotation is removed and how you migrate depends on where you were using it.
For tracing a method on a CDI bean, use the
@WithSpanannotation instead.No replacement is available for using the
@Traced(false)annotation on a RESTful Web Services resource method to prevent tracing of calls to the method. All resource methods are traced automatically.You can use the OpenTelemetry Collector to filter out spans for certain methods.
Start migrating by using the OpenTracing shim
Update your application dependencies to remove the OpenTracing API and add the OpenTelemetry API as a provided dependency and the OpenTracing shim as a regular dependency. For example, add the following dependencies in your Maven pom.xml file:
<dependency>
    <groupId>io.opentelemetry</groupId>
    <artifactId>opentelemetry-api</artifactId>
    <version>1.19.0</version>
    <scope>provided</scope>
</dependency>
<dependency>
    <groupId>io.opentelemetry.instrumentation</groupId>
    <artifactId>opentelemetry-instrumentation-annotations</artifactId>
    <version>1.19.0-alpha</version>
    <scope>provided</scope>
</dependency>
<dependency>
    <groupId>io.opentelemetry</groupId>
    <artifactId>opentelemetry-opentracing-shim</artifactId>
    <version>1.19.0-alpha</version>
</dependency>
Just like the MicroProfile OpenTracing 3.0 feature (mpOpenTracing-3.0), the MicroProfile Telemetry 1.0 feature (mpTelemetry-1.0) feature requires that you enable third-party APIs to use the API classes in your application.
The shim converts most calls to the OpenTracing API into calls to the OpenTelemetry API, but it doesn’t make the OpenTracing Tracer class available for injection. To enable injection of the OpenTracing Tracer class, you also need to add a CDI Producer Method that uses the shim to provide instances of the class for injection. If CDI discovery is enabled, you can add the following class to your application:
import io.opentelemetry.api.OpenTelemetry;
import io.opentelemetry.opentracingshim.OpenTracingShim;
import io.opentracing.Tracer;
import jakarta.enterprise.context.ApplicationScoped;
import jakarta.enterprise.inject.Produces;

@ApplicationScoped
public class ShimProvider {

    @Produces
    @ApplicationScoped
    private Tracer provideTracer(OpenTelemetry openTelemetry) {
        return OpenTracingShim.createTracerShim(openTelemetry);
    }

}
With the configuration changes and the shim in place, your application can run and export traces to your trace service. However, be aware of the limitations on compatibility for the shim.
Switch to the OpenTelemetry API
You can continue to use the OpenTracing API in your code with the OpenTracing Shim. However, you might want to switch to using the OpenTelemetry API directly to take advantage of new features and avoid the limitations of using the shim.
The OpenTelemetry API is similar to the OpenTracing API so the changes to your code are likely to be straightforward. Where you previously injected the io.opentracing.Tracer class, you must instead inject the io.opentelemetry.api.trace.Tracer class and use the methods on that class to create new spans.
As an example, take the following code for the OpenTracing API, which creates and activates a span around an operation:
Span span = tracer.buildSpan("doOperation").start();
try (Scope childScope = tracer.activateSpan(span)) {
    doOperation();
} finally {
    span.finish();
}
Corresponding code that uses the OpenTelemetry API is similar to the following example:
Span span = tracer.spanBuilder("doOperation").startSpan();
try (Scope childScope = span.makeCurrent()) {
    doOperation();
} finally {
    span.end();
}
For more information about the OpenTelemetry API, see the Javadoc.
For more information about migrating to the OpenTelemetry API, see the OpenTelemetry documentation.
Use MicroProfile Telemetry and MicroProfile OpenTracing in the same trace system
If a service in your microservice application is not ready to migrate the trace system from MicroProfile OpenTracing to MicroProfile Telemetry, you can still use MicroProfile Telemetry with your other services. To use both MicroProfile OpenTracing and MicroProfile Telemetry in the same trace system, set a compatible propagator to enable each service to send and receive spans from other services.
Propagators are mechanisms that enable the movement of telemetry data among different services by using HTTP headers. Several propagator standards are available to move span information among microservices. The MicroProfile Telemetry otel.propagators configuration property configures which propagators are used. For a list of the propagators that OpenTelemetry supports, see the Selecting a compatible propagator section.
The following diagram shows two services that produce traces that are collected and exported to Zipkin. Service A is traced with MicroProfile OpenTracing, while service B is traced with MicroProfile Telemetry. When a compatible propagator is enabled, spans from each service can be incorporated in the distributed traces that are sent to Zipkin without losing the original parent-child relationship in the spans.
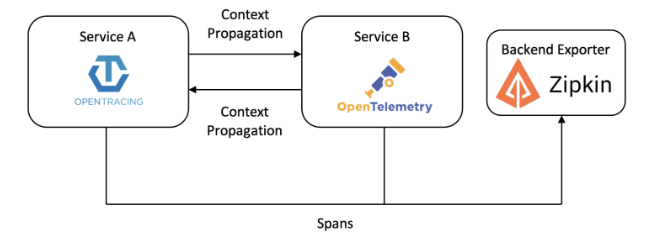
By default, MicroProfile Telemetry uses Trace-Context propagation headers, while MicroProfile OpenTracing uses B3 propagation headers. To export distributed traces successfully to the Zipkin backend exporter, service B must include the B3 propagation header for Zipkin by specifying either the OTEL_PROPAGATORS=b3 environment variable or the otel.propagators=b3 configuration property.
If more than one propagator is enabled, then all headers are added to outgoing requests and any header is accepted for incoming requests. For example, if you are migrating from using a Jaeger client to MicroProfile Telemetry, you might set the otel.propagators=jaeger configuration property to use the Jaeger propagation protocol. Alternatively, you might set the otel.propagators=jaeger,tracecontext,baggage configuration property to allow use of both the Jaeger and W3C protocols.


