
Enabling distributed tracing in microservices with OpenTelemetry and Jaeger
Prerequisites:
Table of contents
Distributed tracing helps teams keep track of requests between microservices. MicroProfile Telemetry adopts OpenTelemetry tracing, so you can observe requests across your distributed systems.
What you’ll learn
The complexity of microservices architecture can make it more difficult to understand how services depend on or affect each other and to identify sources of latency or inaccuracies.
One way to increase the observability of an application is by emitting traces. OpenTelemetry is a set of APIs, SDKs, tooling, and integrations designed to create and manage telemetry data such as traces, metrics, and logs. MicroProfile Telemetry adopts OpenTelemetry so your Java applications can benefit from both manual and automatic traces.
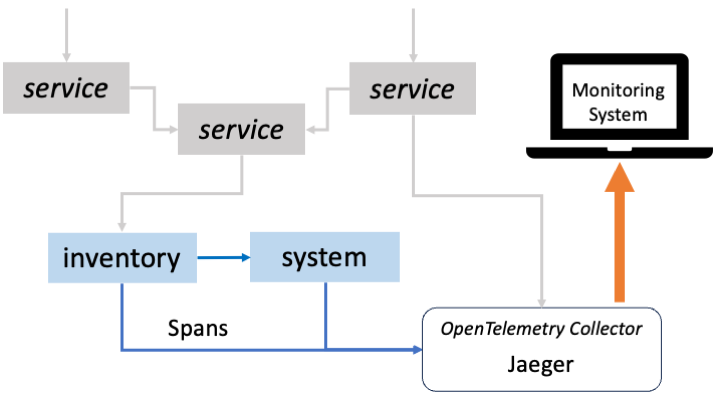
Traces represent requests, which can contain multiple operations or spans. Each span comprises a name, time-related data, log messages, and metadata that describe what occurred during a transaction. Spans are associated with a context, which identifies the request within which the span occurred. Developers can then follow a single request between services through a potentially complex distributed system. Exporters send the data that MicroProfile Telemetry collects to Jaeger so you can visualize and monitor the generated spans.
The diagram shows multiple services, which is where distributed tracing is valuable. However, for simplicity, in this guide, you’ll configure only the system and inventory services to use Jaeger for distributed tracing with MicroProfile Telemetry. You’ll run these services in two separate JVMs made of two Open Liberty instances to demonstrate tracing in a distributed environment.
Additional prerequisites
Before you begin, deploy the Jaeger all-in-one executable file to start the Jaeger tracing system. The Jaeger all-in-one executable file is configured for quick local testing. Jaeger 1.46 or later is recommended. You can find information about the Jaeger server and instructions for starting the all-in-one executable file in the Jaeger documentation.
Before you proceed, make sure that your Jaeger server is up and running by visiting the http://localhost:16686 URL.
Getting started
The fastest way to work through this guide is to clone the Git repository and use the projects that are provided inside:
git clone https://github.com/openliberty/guide-microprofile-telemetry-jaeger.git
cd guide-microprofile-telemetry-jaeger
The start directory contains the starting project that you will build upon.
The finish directory contains the finished project that you will build.
Before you begin, make sure you have all the necessary prerequisites.
Try what you’ll build
The finish directory in the root of this guide contains the finished application. Give it a try before you proceed.
Open a command-line session and navigate to the finish directory. Run the following Maven goal to build the system service and deploy it to Open Liberty:
WINDOWS
MAC
LINUX
mvnw.cmd -pl system liberty:run./mvnw -pl system liberty:run./mvnw -pl system liberty:runOpen another command-line session and navigate to the finish directory again. Run the following Maven goal to build the inventory service and deploy it to Open Liberty:
WINDOWS
MAC
LINUX
mvnw.cmd -pl inventory liberty:run./mvnw -pl inventory liberty:run./mvnw -pl inventory liberty:runAfter you see the following message in both command-line sessions, both of your services are ready:
The defaultServer server is ready to run a smarter planet.
Make sure that your Jaeger server is running and navigate your browser to the http://localhost:9081/inventory/systems/localhost URL.
When you visit this endpoint, you make two GET HTTP requests, one to the system service and another to the inventory service. Both of these requests are configured to be traced, so a new trace is recorded in Jaeger. To view the traces, go to the http://localhost:16686 URL.
You can view the traces for the system or inventory services under the Search tab. If you see only the jaeger-query option in the drop-down menu, wait a little longer and refresh the page to see the application services.
Select the services in the Select A Service menu and click the Find Traces button at the end of the section. You will see the following result:
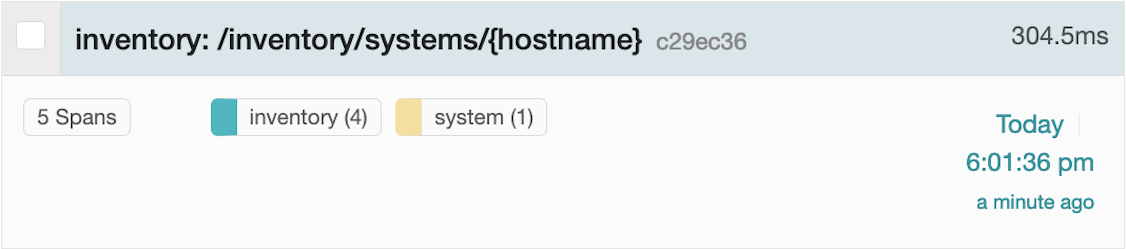
The trace has five spans, four from the inventory service and one from the system service. Click the trace to view its details. Under Service & Operation, you see the spans in this trace. You can inspect each span by clicking it to reveal more detailed information, such as the times that a request was received and a response was sent.
After you’re finished reviewing the application, stop the Open Liberty instances by pressing CTRL+C in the command-line sessions where you ran the system and inventory services. Alternatively, you can run the following goals from the finish directory in another command-line session:
WINDOWS
MAC
LINUX
 mvnw.cmd -pl system liberty:stop
 mvnw.cmd -pl inventory liberty:stop
./mvnw -pl system liberty:stop
./mvnw -pl inventory liberty:stop ./mvnw -pl system liberty:stop
./mvnw -pl inventory liberty:stopBuilding the application
You need to start the services to see basic traces appear in Jaeger.
When you run Open Liberty in dev mode, dev mode listens for file changes and automatically recompiles and deploys your updates whenever you save a new change.
Open a command-line session and navigate to the start directory. Run the following Maven goal to start the system service in dev mode:
WINDOWS
MAC
LINUX
mvnw.cmd -pl system liberty:dev./mvnw -pl system liberty:dev./mvnw -pl system liberty:devOpen a command-line session and navigate to the start directory again. Run the following Maven goal to start the inventory service in dev mode:
WINDOWS
MAC
LINUX
mvnw.cmd -pl inventory liberty:dev./mvnw -pl inventory liberty:dev./mvnw -pl inventory liberty:devAfter you see the following message, your Liberty instance is ready in dev mode:
**************************************************************
*    Liberty is running in dev mode.
Dev mode holds your command-line session to listen for file changes. Open another command-line session to continue, or open the project in your editor.
When the runtime instances start, you can find the system and inventory services at the following URLs:
Enabling Telemetry implementation
Navigate to the start directory to begin.
MicroProfile Telemetry allows you to observe traces without modifying the source code in your Jakarta RESTful applications. You can enable the mpTelemetry feature in the server.xml configuration file.
Replace theserver.xmlfile of the system service:system/src/main/liberty/config/server.xml
system/server.xml
 1<server description="system service">
 2
 3    <featureManager>
 4        <platform>jakartaee-10.0</platform>
 5        <!-- tag::microprofile[] -->
 6        <platform>microprofile-7.1</platform>
 7        <!-- end::microprofile[] -->
 8        <feature>cdi</feature>
 9        <feature>jsonb</feature>
10        <feature>jsonp</feature>
11        <feature>restfulWS</feature>
12        <!-- tag::mpTelemetry[] -->
13        <feature>mpTelemetry</feature>
14        <!-- end::mpTelemetry[] -->
15    </featureManager>
16
17    <httpEndpoint httpPort="${http.port}"
18                  httpsPort="${https.port}"
19                  id="defaultHttpEndpoint" host="*" />
20
21    <webApplication location="guide-microprofile-telemetry-jaeger-system.war"
22                    contextRoot="/" />
23
24</server>
The mpTelemetry feature is now enabled in the server.xml of the system service.
Replace theserver.xmlfile of the inventory service:inventory/src/main/liberty/config/server.xml
inventory/server.xml
The mpTelemetry feature is now enabled in the server.xml of the inventory service.
By default, MicroProfile Telemetry tracing is off. To enable any tracing aspects, specify the otel properties in the MicroProfile configuration file.
Create themicroprofile-config.propertiesfile of the system service:system/src/main/resources/META-INF/microprofile-config.properties
system/microprofile-config.properties
1# tag::service[]
2otel.service.name=system
3# end::service[]
4# tag::disabled[]
5otel.sdk.disabled=false
6# end::disabled[]
7# tag::metrics[]
8otel.metrics.exporter=none
9# end::metrics[]
10# tag::logs[]
11otel.logs.exporter=none
12# end::logs[]The MicroProfile properties file sets the otel.service.name property with the system service name, sets the otel.sdk.disabled property to false to enable tracing, sets the otel.metrics.exporter property to none to disable metrics, and sets the otel.logs.exporter property to none to disable exporting logs.
Replace themicroprofile-config.propertiesfile of the inventory service:inventory/src/main/resources/META-INF/microprofile-config.properties
inventory/microprofile-config.properties
1io.openliberty.guides.inventory.client.SystemClient/mp-rest/url=http://localhost:9080/system
2# tag::otel[]
3otel.service.name=inventory
4otel.sdk.disabled=false
5otel.metrics.exporter=none
6otel.logs.exporter=none
7# end::otel[]Similarly, specify the otel properties for the inventory service.
For more information about these and other Telemetry properties, see the MicroProfile Config properties for MicroProfile Telemetry documentation.
To run the system and inventory services, simply navigate your browser to the http://localhost:9081/inventory/systems/localhost URL. To view the traces, go to the http://localhost:16686 URL.
You can view the traces for the system or inventory services under the Search tab. Select the services in the Select A Service menu and click the Find Traces button at the end of the section. You’ll see the result as:
Verify that there are two spans from the inventory service and one span from the system service. Click the trace to view its details.
Enabling explicit distributed tracing
Automatic instrumentation only instruments Jakarta RESTful web services and MicroProfile REST clients. To get further spans on other operations, such as database calls, you can add manual instrumentation to the source code.
Enabling OpenTelemetry APIs
The MicroProfile Telemetry feature has been enabled to trace all REST endpoints by default in the previous section. To further control and customize traces, use the @WithSpan annotation to enable particular methods. You can also inject a Tracer object to create and customize spans.
Replace theserver.xmlfile of the inventory service:inventory/src/main/liberty/config/server.xml
inventory/server.xml
 1<server description="inventory service">
 2
 3    <featureManager>
 4        <platform>jakartaee-10.0</platform>
 5        <!-- tag::microprofile[] -->
 6        <platform>microprofile-7.1</platform>
 7        <!-- end::microprofile[] -->
 8        <feature>cdi</feature>
 9        <feature>jsonb</feature>
10        <feature>jsonp</feature>
11        <feature>restfulWS</feature>
12        <feature>mpConfig</feature>
13        <!-- tag::mpTelemetry[] -->
14        <feature>mpTelemetry</feature>
15        <!-- end::mpTelemetry[] -->
16    </featureManager>
17
18    <httpEndpoint httpPort="${http.port}"
19                  httpsPort="${https.port}"
20                  id="defaultHttpEndpoint" host="*" />
21
22    <webApplication location="guide-microprofile-telemetry-jaeger-inventory.war"
23                    contextRoot="/">
24        <!-- tag::thirdPartyComment[] -->
25        <!-- enable visibility to third party apis -->
26        <!-- end::thirdPartyComment[] -->
27        <!-- tag::thirdParty[] -->
28        <classloader apiTypeVisibility="+third-party"/>
29        <!-- end::thirdParty[] -->
30    </webApplication>
31
32</server>
The OpenTelemetry APIs are exposed as third-party APIs in Open Liberty. To add the visibility of OpenTelemetry APIs to the application, add third-party to the types of API packages that this class loader supports. Instead of explicitly configuring a list of API packages that includes third-party, set the +third-party value to the apiTypeVisibility attribute in the classLoader configuration. This configuration adds third-party to the default list of API package types that are supported.
Enabling tracing in Jakarta CDI beans
You can trace your Jakarta CDI beans by annotating their methods with a @WithSpan annotation.
Replace theInventoryManagerclass:inventory/src/main/java/io/openliberty/guides/inventory/InventoryManager.java
InventoryManager.java
The list() and add() methods are annotated with the @WithSpan annotation, which can accept an optional parameter that functions as the span name. In this example, the default span name assigned to the list() method is automatically generated through the instrumentation. You can also specify a custom span name. For example, Inventory Manager Add is specified as the span name for the add() method. The OpenTelemetry instrumentation provides a new span for each method. You can now collect and trace the spans across different services.
Optionally, you can include parameters and their values in the span by using the @SpanAttribute annotation. For example, the @SpanAttribute annotation specifies hostname as the attribute name for the host parameter , which helps trace the parameter within the add span.
To learn more about how to use OpenTelemetry annotations to instrument code, see the OpenTelemetry Annotations documentation.
Now, you can check out the traces that are generated by the @WithSpan annotation. Visit the http://localhost:9081/inventory/systems URL and then your Jaeger server at the http://localhost:16686 URL.
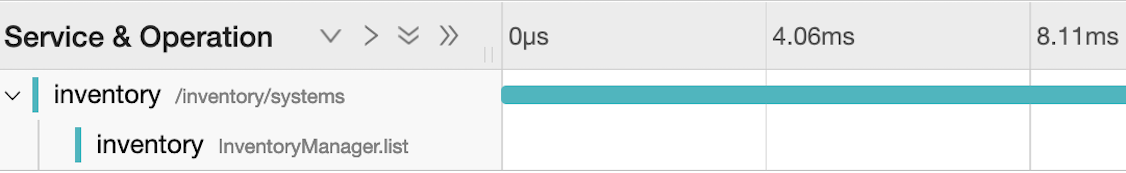
Select the inventory service and click the Find Traces button at the end of the section. You’ll see the result as:
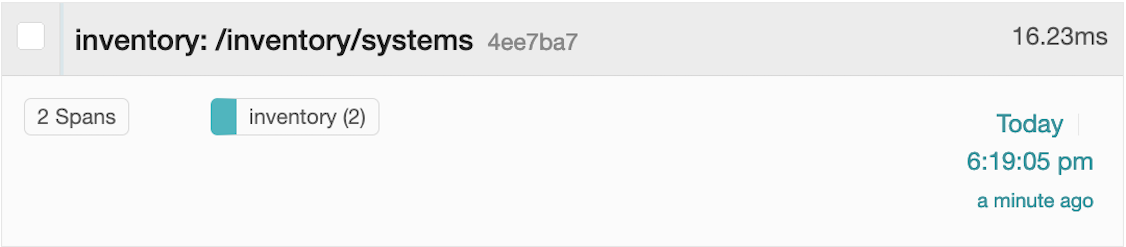
Verify that there are two spans from the inventory service. Click the trace to view its details. You’ll see the InventoryManager.list span that is created by the @WithSpan annotation.
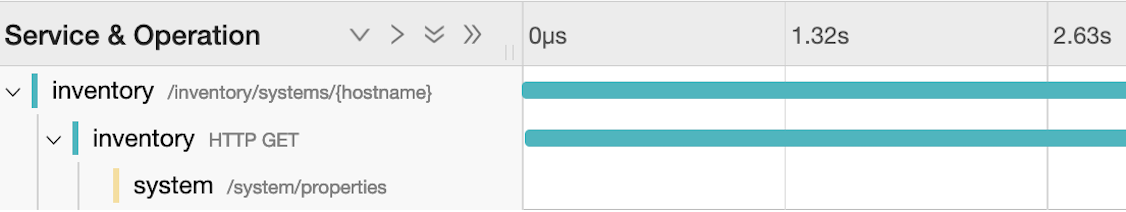
To check out the information generated by the @SpanAttribute annotation, visit the http://localhost:9081/inventory/systems/localhost URL and then your Jaeger server at the http://localhost:16686 URL.
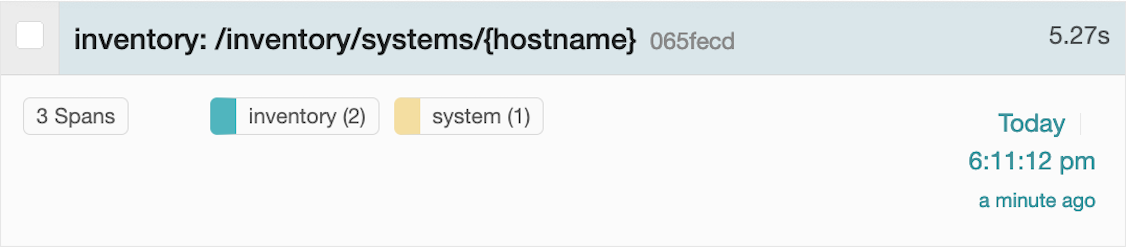
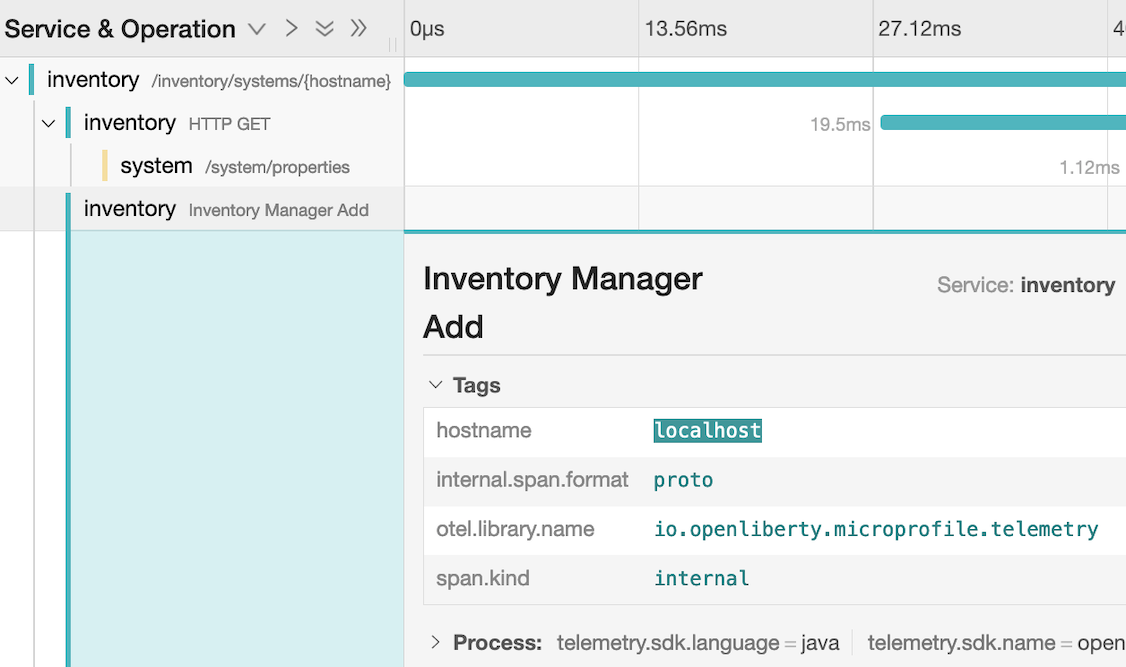
Select the inventory service and click the Find Traces button at the end of the section. You will see the following result:
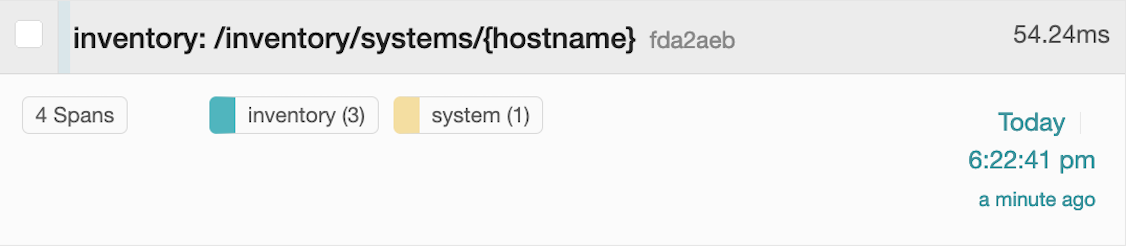
Verify that there are three spans from the inventory service and one span from the system service. Click the trace to view its details.
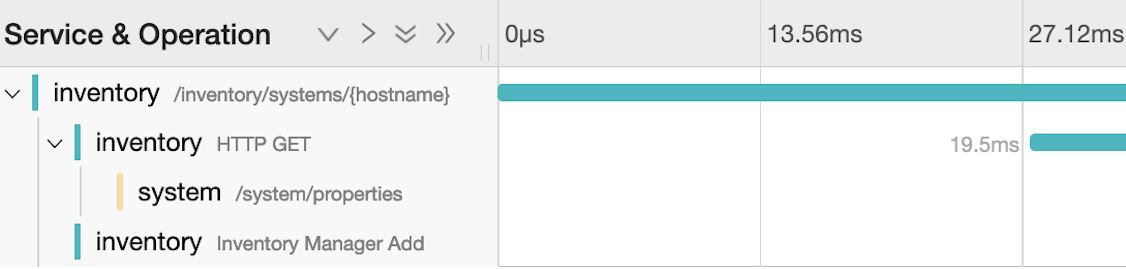
Click the Inventory Manager Add span and its Tags. You can see the hostname tag with the localhost value that is created by the @SpanAttribute annotation.
Injecting a custom Tracer object
The MicroProfile Telemetry specification makes the underlying OpenTelemetry Tracer instance available. The configured Tracer is accessed by injecting it into a bean. You can use it to instrument your code to create traces.
Replace theInventoryResourceclass:inventory/src/main/java/io/openliberty/guides/inventory/InventoryResource.java
InventoryResource.java
To access the Tracer, the @Inject annotation from the Contexts and Dependency Injections API injects the Tracer into a bean.
Before the InventoryManager calls the system service, it creates and starts a span called the GettingProperties by using the spanBuilder() and startSpan() Tracer APIs.
When you start a span, you must also end it by calling end() on the span. If you don’t end a span, it won’t be recorded at all and won’t show up in Jaeger. This code ensures that end() is always called by including it in a finally block.
After you start the span, make it current with the makeCurrent() call. Making a span current means that any new spans created in the same thread, either automatically by Open Liberty or manually by calling the API, will use this span as their parent span.
The makeCurrent() call returns a Scope. Make sure to always close the Scope, which stops the span from being current and makes the previous span current again. Use a try-with-resources block, which automatically closes the Scope at the end of the block.
Use the addEvent() Span API to create an event when the properties are received and an event when it fails to get the properties from the system service. Use the end() Span API to mark the GettingProperties span as completed.
To check out the traces that contain the GettingProperties span, visit the http://localhost:9081/inventory/systems/localhost URL and then your Jaeger server at the http://localhost:16686 URL.
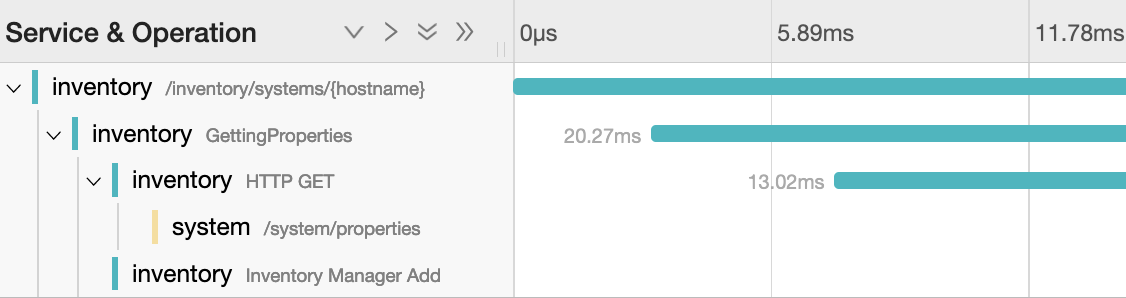
Select the inventory service and click the Find Traces button at the end of the section. You’ll see the result:
Verify that there are four spans from the inventory service and one span from the system service. Click the trace to view its details. You’ll see the GettingProperties span.
To check out the event adding to the GettingProperties span, visit the http://localhost:9081/inventory/systems/unknown URL and then your Jaeger server at the http://localhost:16686 URL.
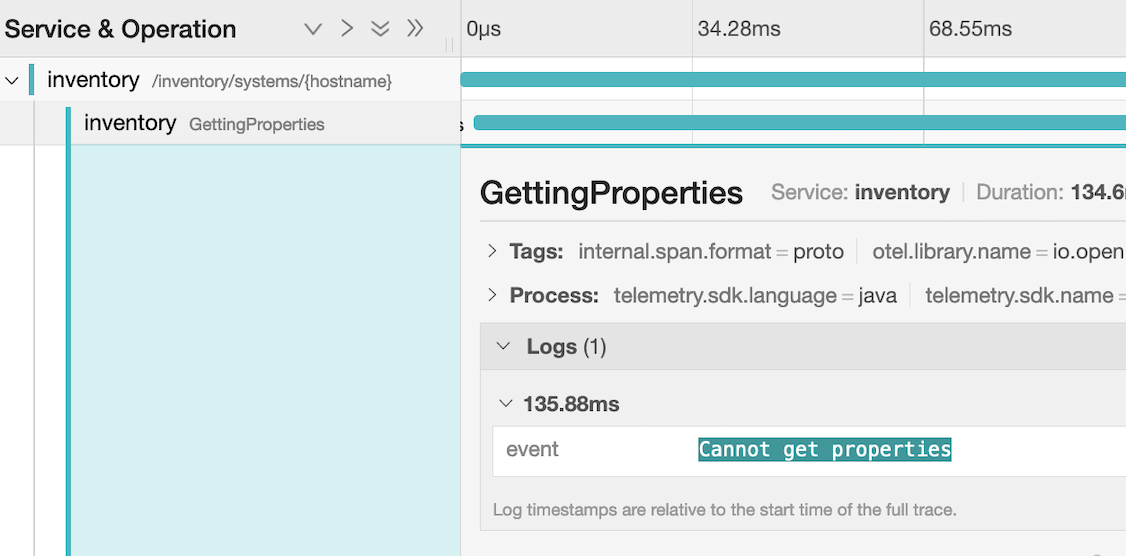
Select the inventory service and click the Find Traces button at the end of the section. You will see the following result:
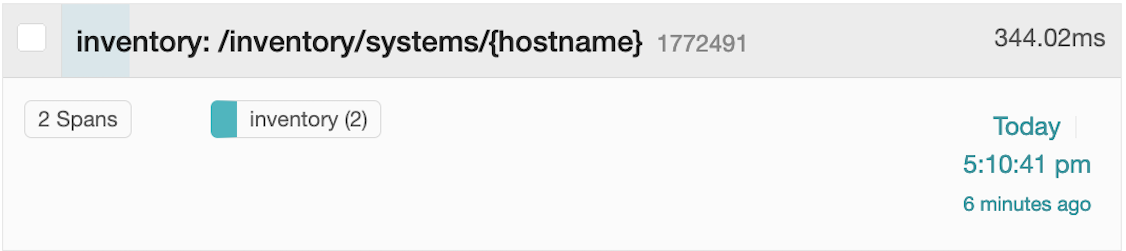
There are two spans from the inventory service. Click the trace to view its details. You’ll see the GettingProperties span. Click the GettingProperties span and its Logs. You can see the Cannot get properties message.
To learn more about how to use OpenTelemetry APIs to instrument code, see the OpenTelemetry Manual Instrumentation documentation.
Testing the application
Manually verify the traces by inspecting them on the Jaeger server. You will find some tests included to test the basic functionality of the services. If any of the tests fail, you might have introduced a bug into the code.
Running the tests
Since you started Open Liberty in dev mode, run the tests for the system and inventory services by pressing the enter/return key in the command-line sessions where you started the services.
When you are done checking out the services, exit dev mode by pressing CTRL+C in the shell sessions where you ran the system and inventory services.
Finally, stop the Jaeger service that you started in the Additional prerequisites section.
Great work! You’re done!
You just used MicroProfile Telemetry in Open Liberty to customize how and which traces are delivered to Jaeger.
Try out one of the related MicroProfile guides. These guides demonstrate more technologies that you can learn to expand on what you built in this guide.
Guide Attribution
Enabling distributed tracing in microservices with OpenTelemetry and Jaeger by Open Liberty is licensed under CC BY-ND 4.0

Copied to clipboard
Prerequisites:
Great work! You're done!
What did you think of this guide?


Thank you for your feedback!
What could make this guide better?
Raise an issue to share feedback
Create a pull request to contribute to this guide
Need help?
Ask a question on Stack Overflow


