 See all blog posts
Improving user experience with custom access logs
How can you improve your web application to serve your clients with a better user experience? Let’s take an example of an e-commerce web application. Maybe you want to determine the most active users so that you can invite them to try the beta version of a new part of your website. Maybe your website goes down, and you want to check which users were active around that time so you can send them coupons to encourage them to come back. This is where access logs come into play!
Including additional information in your logs about client requests to your Open Liberty servers can be useful for analyzing those application servers. Open Liberty has the ability to write access logs in JSON format to either your messages.log file or to the output of your server console. This makes it easy for your log analysis solution to ingest and visualize patterns in your access logs. Starting in version 20.0.0.8, we extended this capability so that you can configure your JSON access logs to have the same set of fields as your http_access.log file. You can customize your access logs to be sent to different log aggregation and analysis tools that consume JSON, such as Elastic Stack, depending on your needs.
Enabling access logging in Open Liberty
Server configuration for access logging is done in the server.xml file. Set the accessLogging element inside the httpEndpoint element. Then, specify the log format that you want to include in your access log by including a list of tokens, which are based on NCSA options, with the logFormat attribute. This configuration only pertains to a single endpoint. Referring back to our e-commerce website example, if you want to check which user sent a request, you can add the %u token to your logFormat attribute, and the username of the client is included in your access log output:
<httpEndpoint id="defaultHttpEndpoint" httpPort="9080" httpsPort="9443" host="*">
    <accessLogging logFormat="%h %p %m %s"/>
</httpEndpoint>
You can also create a global httpAccessLogging element that’s referenced by multiple httpEndpoint elements:
<httpAccessLogging id="access_log" logFormat="%h %p %m %s"/>

<httpEndpoint id="defaultHttpEndpoint” accessLoggingRef="access_log"
                  host="*"
                  httpPort="9092"
                  httpsPort="9493" />

<httpEndpoint id="adminHttpEndpoint” accessLoggingRef="access_log"
                  host="*"
                  httpPort="9093"
                  httpsPort="9494"/>
You can find more information about customizing the logFormat attribute in the Open Liberty HTTP access logging documentation.
Enabling JSON format
To enable logging in JSON format, set the com.ibm.ws.logging.console.format property to json in your bootstrap.properties file.
Add accessLog as one of the sources in the com.ibm.ws.logging.console.source property. By default, the server’s JSON access log has a fixed set of fields. To customize your access log fields, you can set the com.ibm.ws.logging.json.access.log.fields property to logFormat so only the tokens that you specified in your logFormat attribute show up in your access log. The following example shows a configuration that you might add to your bootstrap.properties file:
com.ibm.ws.logging.console.format=json
com.ibm.ws.logging.console.log.level=info
com.ibm.ws.logging.console.source=message,trace,accessLog,ffdc,audit
com.ibm.ws.logging.json.access.log.fields=logFormat
The following example shows JSON access log output:
{
     "type":"liberty_accesslog",
     "host":"localhost",
     "ibm_userDir":"\/root\/wlp\/usr\/",
     "ibm_serverName":"defaultServer",
     "ibm_remoteUserID":"steve",
     "ibm_remoteHost":"127.0.0.1",
     "ibm_requestMethod":"GET",
     "ibm_requestPort":"9443",
     "ibm_responseCode":200,
     "ibm_datetime":"2020-11-02T10:45:36.917-0500",
     "ibm_sequence":"1604331936911_0000000000002"
}
Typically, you configure log analysis tools to consume and forward either the output of the server console or the messages.log file output. In cases where you prefer to have Open Liberty forward logs directly to Logstash, use the Logstash Collector feature. When this feature is enabled, it sends your events directly to your Logstash server. Similar to JSON logging, specify the log events that you want to send to Logstash and set the jsonAccessLogFields attribute to logFormat to customize the server logs that are sent to Logstash.
Visualizing your data
Looking at our e-commerce website example, let’s address how we can improve user experience by analyzing the usage patterns of users. You can send your logs to log analysis tools, such as Elastic Stack, and create dashboards to analyze the requests coming in to your servers.
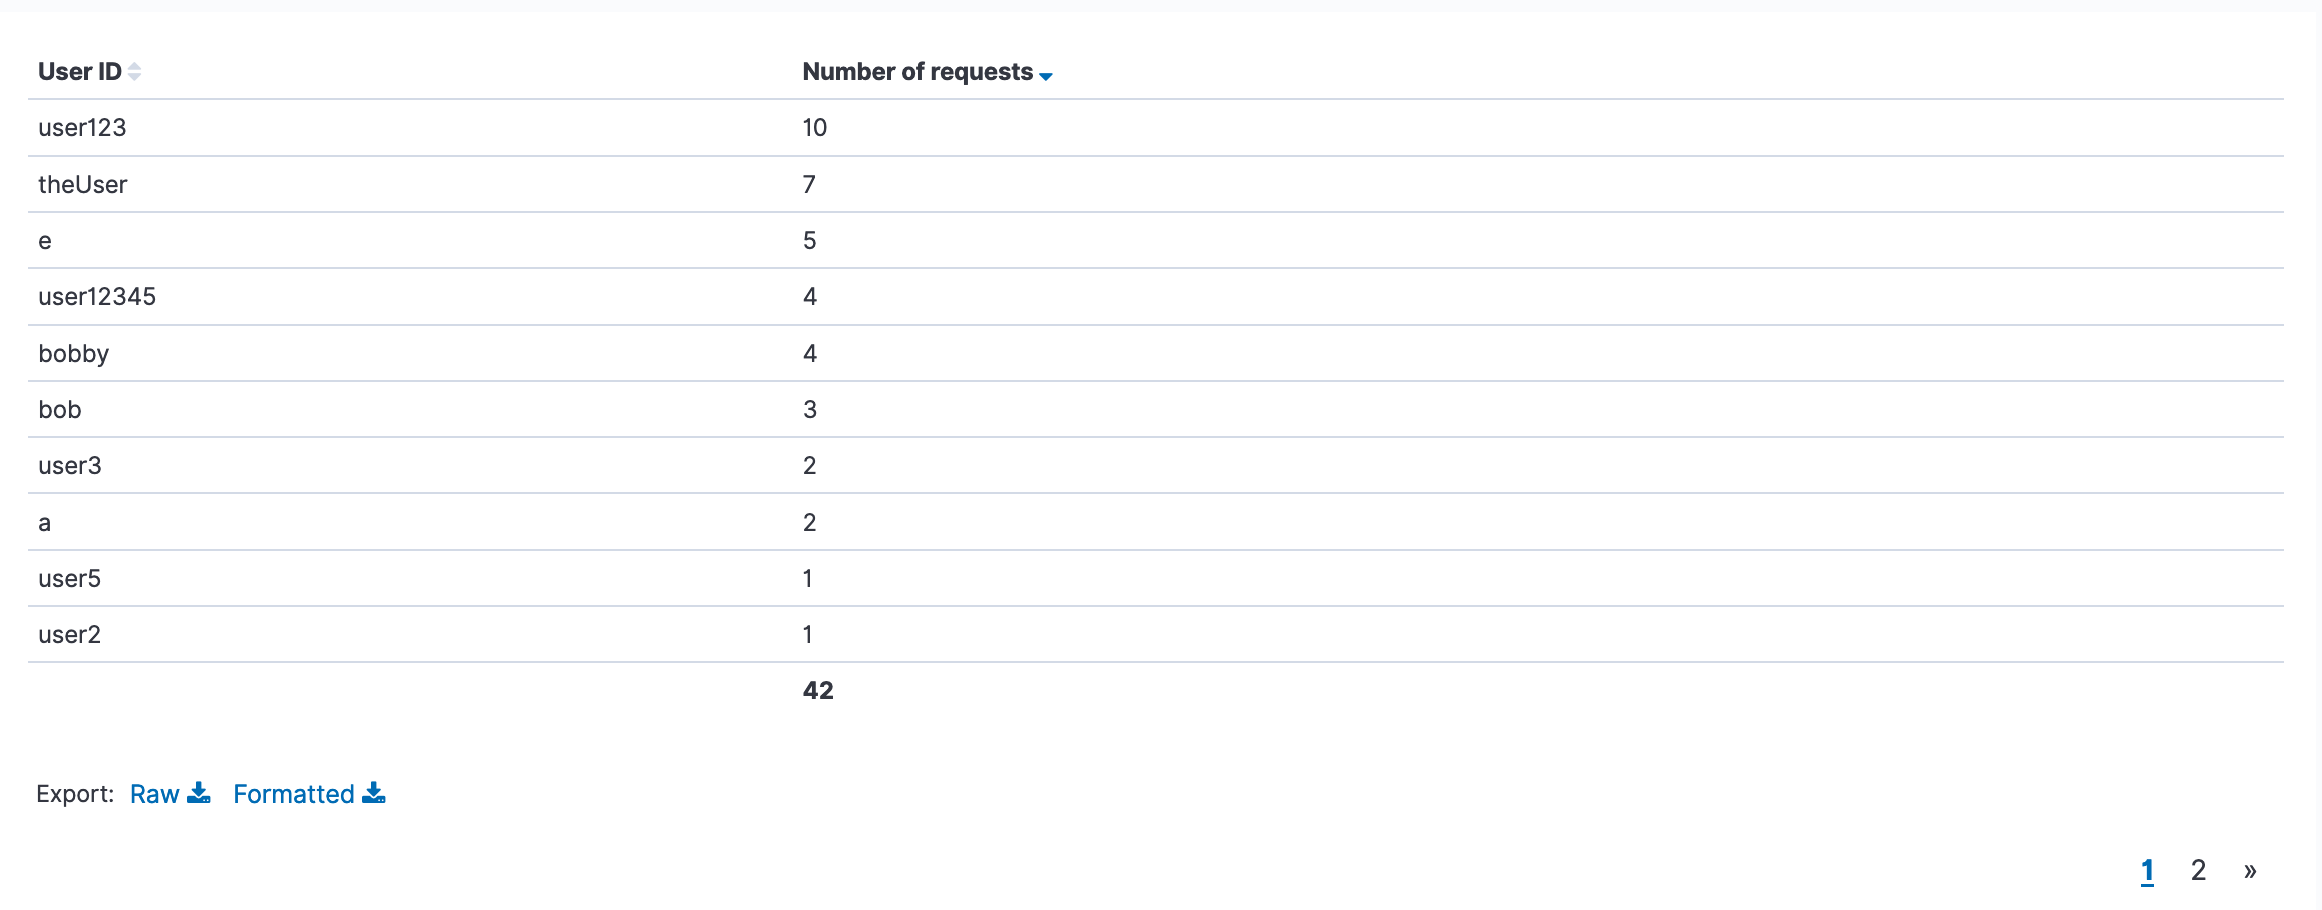
If you want to determine which users are most active and allow them to access a new beta feature, you can create a table to determine your top users:

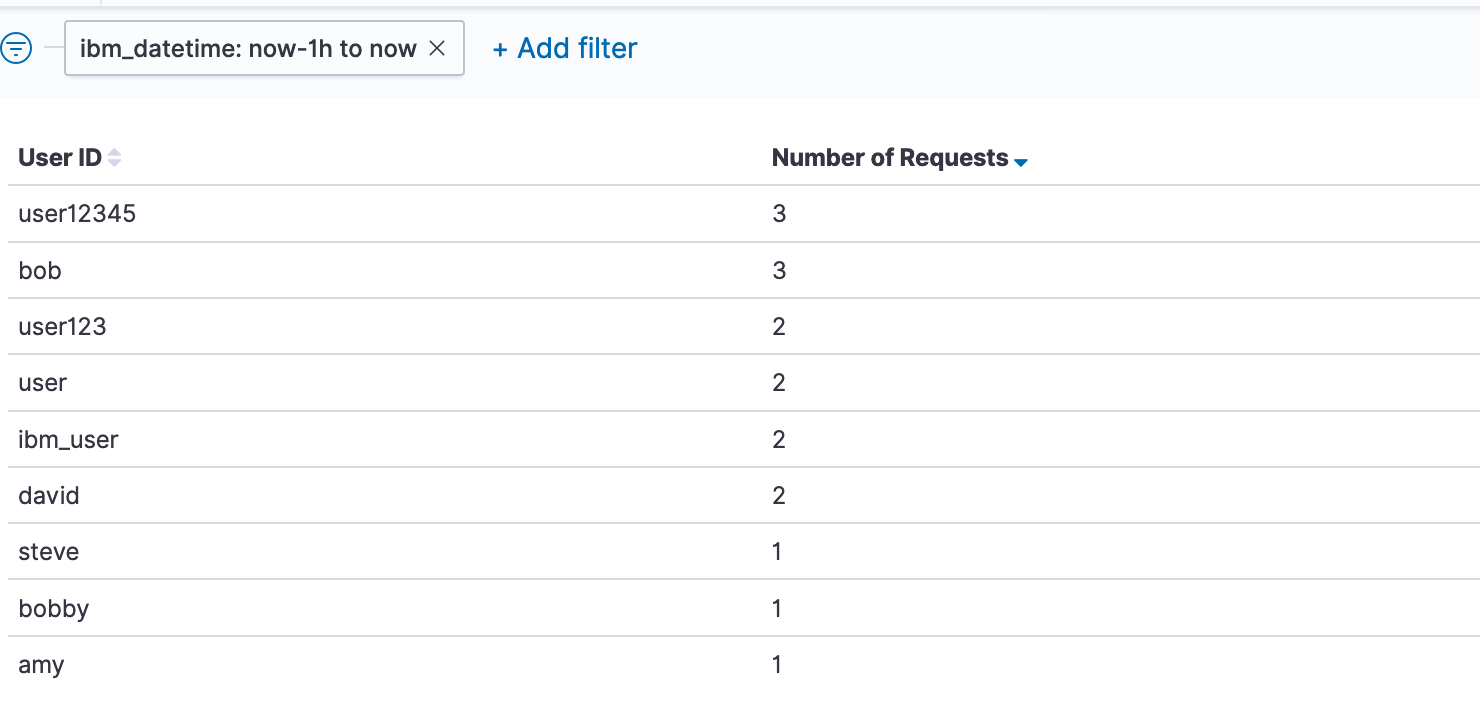
You can also determine which users were online in a particular time period, such as when your website went down, by filtering on the ibm_datetime field:

The freedom to customize your access log fields with additional information can be useful for analyzing user patterns. You might compare servers to identify latencies in certain servers by using the %D token in the logFormat attribute and the elapsedTime field. You could also check the average bytes transferred over time by using %b token in the logFormat attribute and the bytesSent field. Or, check which browsers particular users are working on when they report problems with the %{user-agent}i token in the logFormat attribute and the userAgent field. The ability to customize your access log fields can help you make decisions to improve your web applications, leading to happy customers!


