New simple timer metric with MicroProfile Metrics 2.3

The new simple timer metric debuted with the release of MicroProfile Metrics 2.3, which is available to use in Open Liberty. The simple timer is a lightweight alternative to the existing timer metric and will satisfy most use cases for timers. A simple timer is practical if your metric data is intended to be fed into the Prometheus monitoring tool because using PromQL functions is an effective way to formulate additional values from raw metric data.
Like the timer metric, the simple timer works by tracking timing durations and the frequency of invocations where the metric is instrumented. Unlike the timer metric, which reports 14 different values, the simple timer reports only those two values—timing duration and frequency of invocation. In this post, we’ll highlight the benefits of using the simple timer with Prometheus.
Four of the 14 metric values that are provided by the timer represent the mean, 1-minute, 5-minute, and 15-minute rates.
These calculations can be easily deferred to the Prometheus client side with the use of the PromQL rate() function and range vector selectors.
The simple timer also has the ability to report the total elapsed timing duration, which the existing timer currently lacks. If all you want to do is simply time something, then the simple timer should be your metric of choice.
Simple timer usage
Before we begin, configure Open Liberty with the MicroProfile Metrics 2.3 feature in your server.xml file:
<server>
    <featureManager>
        <feature>mpMetrics-2.3</feature>
        ...
    </featureManager>
    ...
</server>
Like all metrics available in MicroProfile Metrics, the simple timer can be instrumented into your application with annotations or instrumented and manipulated programmatically. In this blog, we’ll use annotations. For more information about using the simple timer programmatically, see the Java API documentation.
The annotation for the simple timer is @SimplyTimed.
The following example shows how to use the simple timer annotation with the available annotation parameters:
@SimplyTimed(name=“sampleSimplyTimed”, displayName=”mySampleSimpleTimer”, description=”A simple timer description”, absolute=true, reusable=true,  tags= {"tag1=value1", "tag2=value2"})

public void simplyTimeSomething() {
   Thread.sleep(2000);
}
For more information, check out the annotation API or an overview of the metric attributes, which the annotation parameters are used to define.
You can view the metric data at the /metrics REST endpoint.
By default, metric data is formatted in Prometheus format.
The following example shows output of a GET request to the /metrics endpoint with text/plain for Prometheus-formatted data:
# TYPE application_sampleSimplyTimed_total counter
# HELP application_sampleSimplyTimed_total A simple timer description
application_sampleSimplyTimed_total{colour="blue",shape="square"} 1
# TYPE application_sampleSimplyTimed_elapsedTime_seconds gauge
application_sampleSimplyTimed_elapsedTime_seconds{colour="blue",shape="square"} 2.620000000
REST metrics
With the simple timer metric, runtimes can track and monitor the usage of REST or JAX-RS method resources and report them with a simple timer metric.
The metrics created by the runtime have a REST.request metric name and are labeled with their fully qualified class name and method signature.
The following example is from the MicroProfile Metrics specification about the REST.request metric:
Given the following RESTful resource:
package org.eclipse.microprofile.metrics.demo;

@ApplicationScoped
public class RestDemo {

  @POST
  public void postMethod(String... s, Object o){
      ...
  }
}
The Prometheus-formatted REST metrics are:
# TYPE base_REST_request_total counter
base_REST_request_total{class="org.eclipse.microprofile.metrics.demo.RestDemo",method="postMethod_java.lang.String[]_java.lang.Object"} 1
# TYPE base_REST_request_elapsedTime_seconds gauge
base_REST_request_elapsedTime_seconds{class="org.eclipse.microprofile.metrics.demo.RestDemo",method="postMethod_java.lang.String[]_java.lang.Object"} 1.000
Viewing data with Prometheus and Grafana
You need a way to record and view metrics from all of your servers. A common approach is to use Prometheus and Grafana. Prometheus is an open source monitoring tool that’s used for retrieving and indexing metric data exported in the Prometheus format. Grafana, which is also an open source monitoring tool, can utilize that data and display it with graphs and visualizations.
We’ll use the REST section of the mpMetrics 2.x Grafana dashboard, which is provided by the Open Liberty team, to illustrate a few possible visualizations that can be created from simple timer metric data. Download this dashboard from the Grafana website.
First, let’s look at a quick explanation of the underlying runtime and application environment:
-
Two Open Liberty servers are running the same application in two separate Docker containers.
-
One OpenLiberty instance is named
OpenLiberty. -
One OpenLiberty instance is named
OpenLiberty2.
-
-
Two
GETREST endpoints are in the application.-
One of the
GETREST method resources, namedgetMethod, accepts no parameters. -
One of the
GETREST method resources, namedgetMethodParam, accepts one parameter of ajavax.ws.core.HTTPHeaderobject. Unfortunately, the full value of the method signature is cut off in the Grafana legend.
-
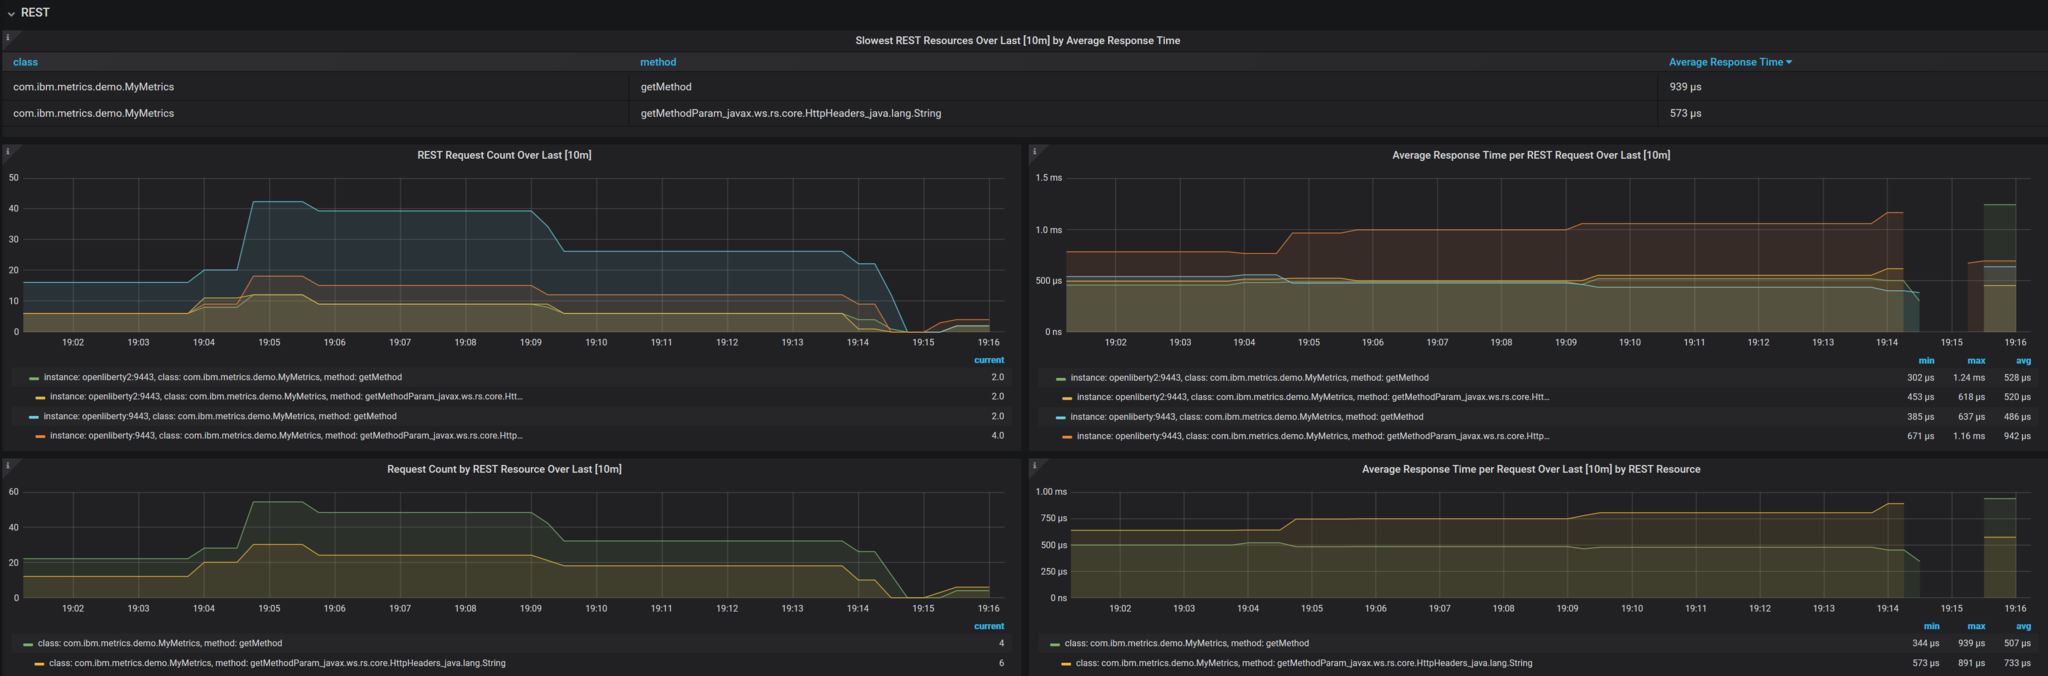
The following image shows Grafana REST dashboard visualizations that we’ll explore in the following sections:
The PromQL queries in the following sections originally used the {instance=~"[[instance]]"} label scope and [[dur]] variable.
These values are defined by the dashboard.
The default is all instances with a duration of 10m (10 minutes).
For ease of readability, the {instance=~"[[instance]]"} label scope is omitted and the [[dur]] variable was substituted with 10m.
REST Request Count Over Last [10m]
PromQL Query: increase(base_REST_request_total[10m])
This graph visualization queries and calculates the request count for each REST method resource for the last 10 minutes by using the REST simple timer count value.
To effectively show this data, we use the increase() function with a range vector selector of 10m.
Request Count by REST Resource Over Last [10m]
PromQL Query: sum(increase(base_REST_request_total[10m])) by (class, method)
This graph visualization is similar to the previous one.
As before, we are calculating the request count for the last 10 minutes.
However, now we are aggregating the metric data of matching metrics, which are metrics with matching REST method resources, across multiple applications or container instances and combining them into one.
This aggregation is accomplished by calling the sum() aggregation operator to add up the metric values that are acquired from using the by clause.
Our use of the by clause in this query limits the metric dimension to only the class and method labels, which allows us to aggregate across the instance label dimension.
Average Response Time per REST Request Over Last [10m]
PromQL Query: rate(base_REST_request_elapsedTime_seconds[10m]) / rate(base_REST_request_total[10m])
This graph visualization queries and calculates the average response time for each REST method resource for the last 10 minutes by using the simple timer elapsedTime and count metric values.
The rate() function is necessary for use with the range vector selector.
Average Response Time per Request Over Last [10m] by REST Resource
PromQL Query: avg(rate(base_REST_request_elapsedTime_seconds[10m]) / rate(base_REST_request_total[10m])) by (class, method)
This graph visualization is similar to the previous one.
We are calculating the average response time of REST endpoints for the last 10 minutes.
However, now we are aggregating the metric data of matching metrics, which are metrics with matching REST method resources, across multiple applications or container instances and combining them into one.
This aggregation is accomplished by calling the avg() aggregation operator to calculate the average of the metric values acquired with the by clause.
Our use of the by clause in this query limits the metric dimension to only the class and method labels, which allows us to aggregate across the instance label dimension.
Slowest REST Resources Over Last [10m] by Average Response Time
PromQL Query: avg(rate(base_REST_request_elapsedTime_seconds[10m]) / rate(base_REST_request_total{instance=[10m])) by (class, method) > 0
This table visualization is simply a table form of the previous Average Response Time per REST Request Over Last [10m] visualization. The table shows the slowest REST resources by sorting the table from highest to lowest average response time.
By combining just the two values provided by the simple timer with PromQL functions, we can create visualizations that are helpful for monitoring REST method resources from a single instance or a highly scaled operation environment. Similar visualizations can be created for simple timer metrics that are instrumented in applications.
Additional visualizations can be created with further use of PromQL functions to suit the particular needs of different users. The mpMetrics-2.x Grafana dashboard hosts many other visualizations that are created from metric data exported by Open Liberty. To download Open Liberty Grafana dashboards for OpenShift Container Platform, go to the Open Liberty Operator’s Grafana dashboard documentation.
Summary
The simple timer metric brings a simple yet powerful new metric into the world of MicroProfile Metrics. Its addition into the specification also brought with it the inclusion of REST endpoint monitoring for the MicroProfile Metrics runtime. Combined with using PromQL functions in Grafana, the simple timer is highly versatile for building graphs and visualizations. The simple timer is much more lightweight than the timer, while still providing enough information for most use cases.


