Observe microservices using metrics, logs and traces with MicroProfile Telemetry 2.0

A microservices architecture has many well-known advantages for developers such as scalability, flexibility and improved collaboration. However, having a distributed system is likely to make it harder to find the source of latency or inaccuracy that users may experience. There are multiple ways to increase observability of an application to overcome this problem (e.g. by collecting metrics, traces and logs).
OpenTelemetry contains a set of APIs, SDKs, tooling, and integrations that are designed for the creation and management of telemetry data such as traces, metrics, and logs. MicroProfile Telemetry 2.0 adopts OpenTelemetry so your MicroProfile applications benefit from both manual and automatic traces and metrics. These can be collectively exported along with runtime and application logs in a standardized way!
This post demonstrates an application consisting of two services which are hosted on separate servers:
-
Person service: Allows users to create records of people, given their name and age.
-
Car service: Allows users to create records of cars, given the make of the car and the id of the person who owns the car.
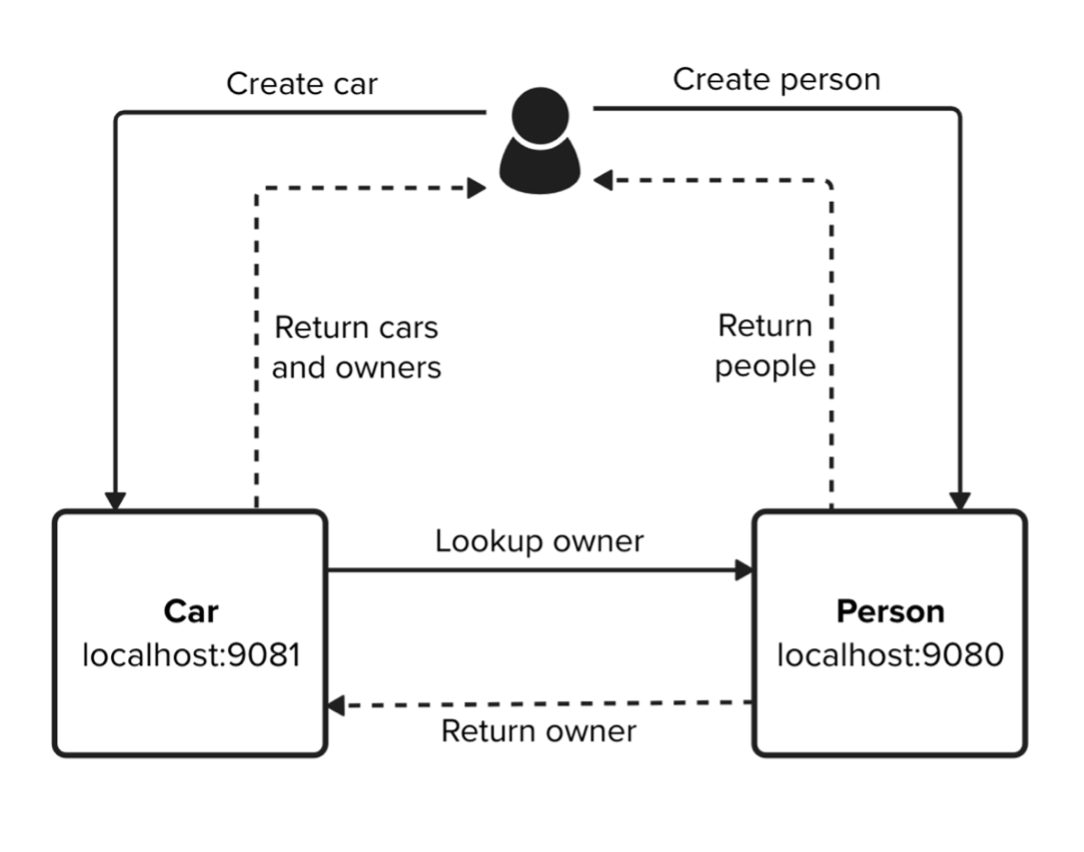
When a user interacts with the car service, they experience some latency with their response but the reason for this is not yet clear. There are numerous possibilities that could cause the latency such as network unreliability, hardware limitations, request timeouts and code complexity. The exact operation that has the problem is not always obvious. Therefore, we would need to collect data to work out which part of the distributed system is causing the issue.
To do this, we can collect:
-
Logs from the servers and application to be aware of events and the time that they occurred.
-
Runtime metrics including numerical data about the infrastructure for the application, for example, CPU utilization and the JVM behaviour including the number of threads and classes.
-
Application metrics for the incoming and outgoing HTTP requests.
-
Traces and spans to track user operations, including both the requests and responses.
Exporters are systems that send data to a backend service so you can visualise and monitor the spans, metrics and logs.
The following section illustrates how to set up a backend service.
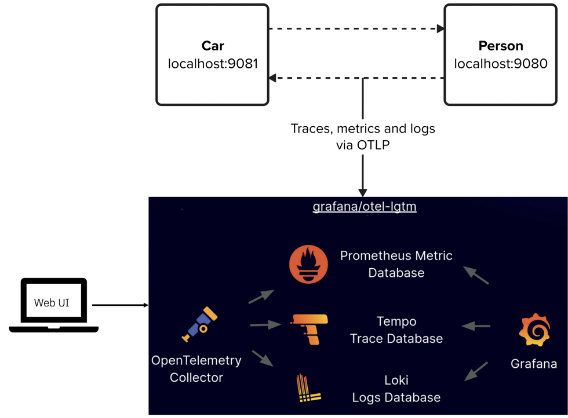
Running the monitoring backend
The backend system is set up to collect the telemetry data from the application. See the docker-otel-lgtm repository and clone the repo:
git clone https://github.com/grafana/docker-otel-lgtm.git
cd docker-otel-lgtm/docker
Build and run the image containing all services required for gathering traces, metrics and logs:
podman build . -t grafana/otel-lgtm
podman run -p 3000:3000 -p 4317:4317 -p 4318:4318 --rm -ti localhost/grafana/otel-lgtm
Telemetry data can be visualized in the Grafana dashboard which is provided by starting the backend service. You can navigate to the dashboard with the following url when the services are up and running:
The backend system is set up to collect telemetry data via the OTLP protocol which is default behaviour for Open Telemetry. Therefore, additional configuration for the exporter is not required in the application.
The demo app
Check out the demo repo and clone the repository:
git clone https://github.com/yasmin-aumeeruddy/car-person-demo.gitEach service has mpTelemetry2.0 server:
<featureManager>
        ...
        <feature>mpTelemetry-2.0</feature>
</featureManager>
Due to performance concerns, MicroProfile Telemetry is disabled by default. To collect and export telemetry data, enable OpenTelemetry by using the following system property or environment variable:
-
System property: otel.sdk.disabled=false
-
Environment variable: OTEL_SDK_DISABLED=false
In the demo, the required configuration is set in bootstrap.properties.
Note that configuration is shared amongst all applications on a single server to allow for telemetry data when system properties or environment variables are used. If you wish to use separate configuration for each application, you can use alternative MicroProfile Configuration properties; however, this will prevent the generation and collection of runtime telemetry data. For more information, see Collecting and exporting logs, metrics, and traces with OpenTelemetry.
The Performance Monitoring 1.0 feature (monitor-1.0) is automatically enabled by MicroProfile Telemetry 2.0 to capture runtime component statistics. This statistical data is registered as metrics in the telemetry runtime and can be forwarded to any OpenTelemetry Protocol (OTLP) compatible metric consumer to meet your monitoring needs.
The server.xml also contains the following MpTelemetry property to allow MicroProfile Telemetry to collect message logs:
<mpTelemetry source="message"/>For a full list of available logging event types, see the MicroProfile Telemetry log events reference list.
Automatic instrumentation
Without any code instrumentation, the following components are automatically collected and exported to the backend exporter in the Person service:
-
Runtime metrics including:
-
ThreadPool
-
Sessions
-
RequestTiming
-
ConnectionPool
-
HTTP metrics
-
Message logs
-
Requests and responses to Jakarta RESTful Web Services
Start the Person service:
cd person
mvn liberty:dev
To create a new person with the name Bob and age 21, navigate to:
You will see confirmation that a person has been created with a unique id:
Person created with id 5859008369859564999
To view all the people that you have created, navigate to:
You should see a result like the following, with the unique id shown previously:
{"age":21,"id":5859008369859564999,"name":"bob"}
View the traces that were automatically created from your request in the Grafana dashboard.

View the messages logs to see timestamped events from the server startup in the dashboard.
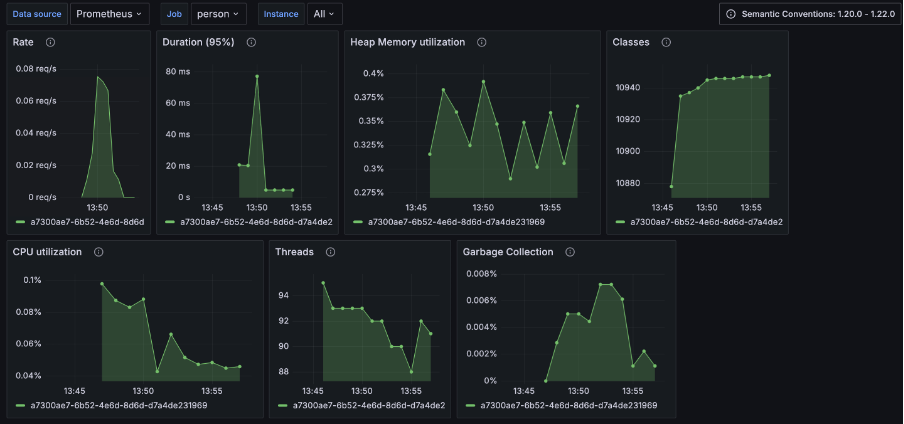
View an overview of the JVM metrics, including the number of classes, CPU utilization and heap memory utilization in the dashboard.
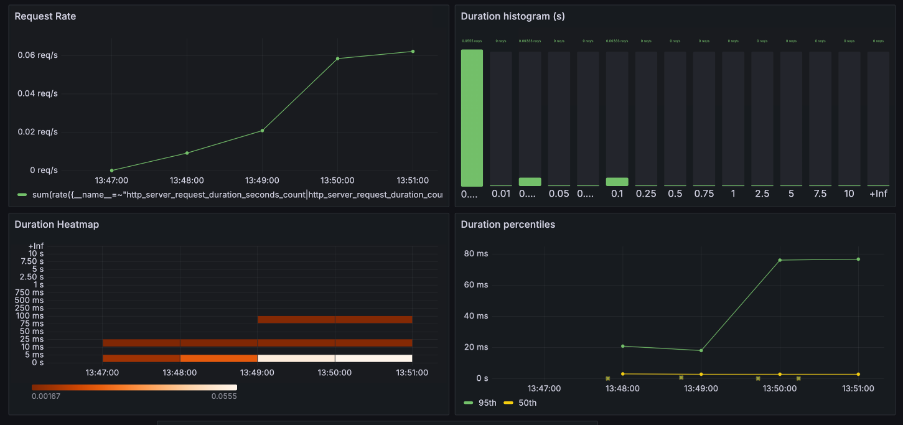
View an overview of the HTTP metrics to see graphs that show the duration of HTTP requests in the dashboard.
Use the OpenTelemetry API to manually create metrics
In addition to the supported runtime metric components, you can also use the OpenTelemetry metrics API to define custom metrics in your application code. Before instrumenting your code, the following prerequisite is required:
-
Third-party APIs must be made visible for your application in the
server.xml. You can see that this configuration is present here.:
<webApplication location="demo-microprofile-telemetry-car.war" contextRoot="/">
    <!-- enable visibility to third party apis -->
    <classloader apiTypeVisibility="+third-party"/>
</webApplication>
You can the use the OpenTelemetry API to create custom metrics. In CarService.java, Meter is used to define instruments, in this case, a counter.
@Inject
Meter meter;

LongCounter carCreatedCounter;

@PostConstruct
public void init(){
    carCreatedCounter = meter.counterBuilder("car.created").build();
}
The value of the counter is incremented in the createCar method:
carCreatedCounter.add(1);For a full list of available metrics, see the meter operations in the OpenTelemetry documentation.
Start the Car service in another terminal:
cd car
mvn liberty:dev
Create a car associated with the person that you created using the Person service. To do this, navigate to the following endpoint replacing the personId with the id shown in your previous result from http://localhost:9080/people:
When the car has been created, a HTTP request is sent to the Person service to return the details of the person with the given id. Consequently, you should see a result like the following
Car created with id 3644955172396212837 owned by {"age":21,"id":5859008369859564999,"name":"bob"}
To view all the cars you have created, navigate to:
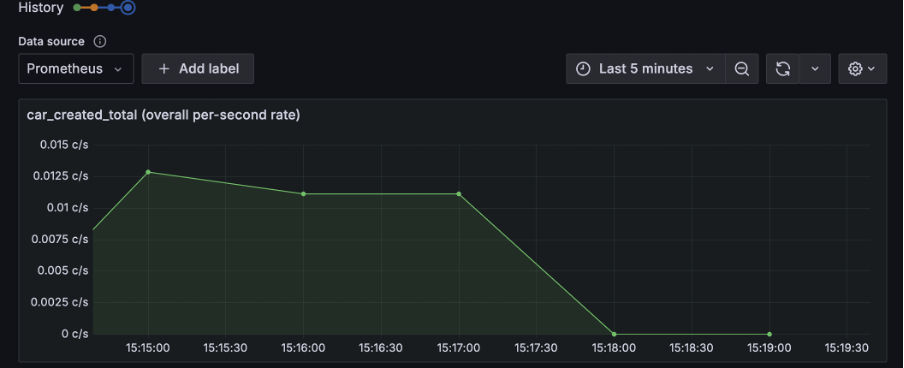
View the graph that shows the custom metric representing the number of cars created in the dashboard.
Observe application logs
Log messages are created in PersonClient.java to show when events occur. For example, an INFO message is created when a new client is built:
private static final Logger julLogger = Logger.getLogger("jul-logger");

...

private void initHelper(String hostname, int port, Long personId) {
    this.url = buildUrl(PROTOCOL, hostname, port, PEOPLE + personId);
    julLogger.log(Level.INFO, "Building client for url " + url);
    this.clientBuilder = buildClientBuilder(this.url);
}
You can see the additional custom application logs in the dashboard.
Use the OpenTelemetry API to manually create traces
The CarService.java class injects a Tracer and Span called carNotFoundSpan.
@Inject
Tracer tracer;[source, java]
...
@Inject
Span carNotFoundSpan;
The span is started if a car is not found with the Id that is used to query the getCar method:
@GET
@Path("/getCar/{carId}")
public Car getCar(@PathParam("carId") @NotEmpty Long id) throws InterruptedException {
    ...
    if (foundCar == null){
        carNotFoundSpan = tracer.spanBuilder("carNotFound").startSpan();
        try(Scope subScope = carNotFoundSpan.makeCurrent()){
            Thread.sleep(3000);
            return "Car with id " + id + " not found.";
        }
        finally{
            carNotFoundSpan.end();
        }
    }
    ...
}
Navigate to the following endpoint to start the aforementioned spans:
You may notice significant latency. See the manually created subspan by viewing the most recent trace in the dashboard.
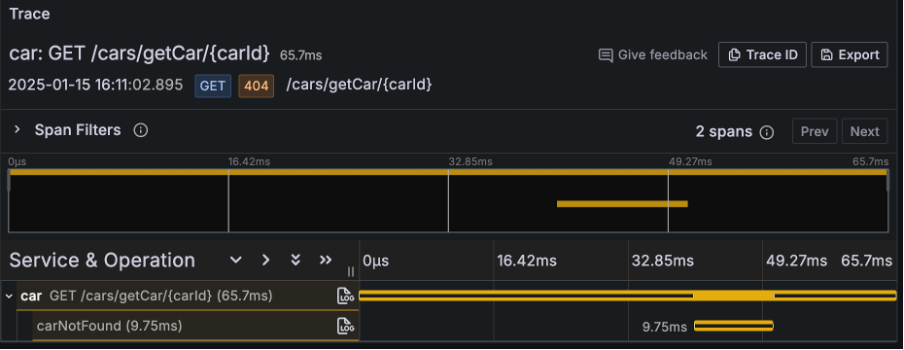
We can see that the total time taken for the trace is over a minute. This is a significant amount of time. To investigate further, select the TraceID and open the tab labelled Node Graph.
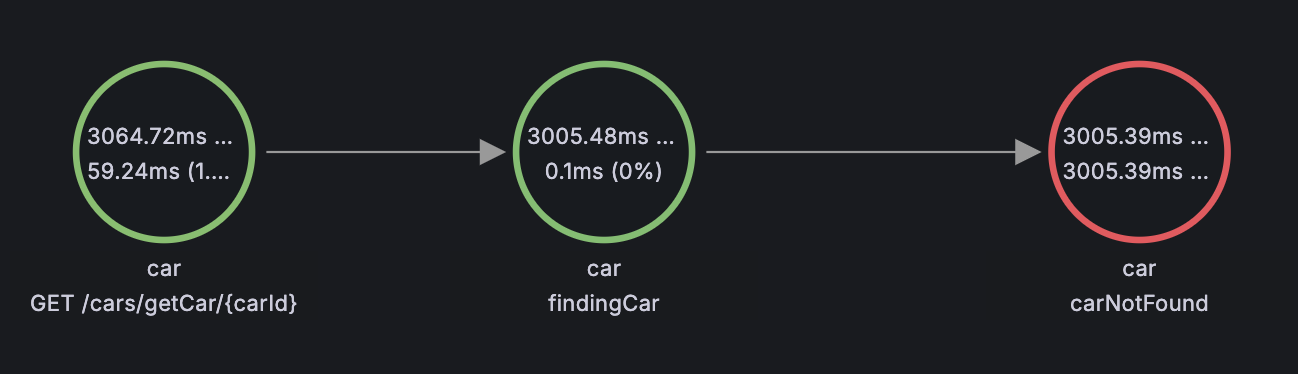
The graph highlights the carNotFound span in red, showing that it was a time consuming process in the request. When looking at the code that is executed during the span, we can see a pause in execution. This would be the cause for the latency that we experienced when interacting with the Car service:
Thread.sleep(3000);Removing this line of code significantly reduces the time it takes for the user to get a response. We have successfully identified an inefficiency using the backend service!
Analyzing telemetry data
As previously shown, analyzing traces, metrics and logs becomes a crucial step in understanding the behavior of your distributed microservices architecture. It is important to do the following:
-
Identify bottlenecks
Bottlenecks and evidence of inefficiencies can be highlighted with traces. Spans with long durations can be found by finding the longest path in a trace. Additionally, repeated spans or high failure rates indicate problematic dependencies or transient errors.
-
Diagnose failures
Traces have multiple attributes that help identify failures such as error codes and exception details.
-
Correlate traces with and metrics
Performance data from runtime metrics like CPU usage, memory consumption, or request rates can be correlated with traces. For example, if a span indicates high latency, you can check corresponding metrics to identify the underlying cause, such as a resource constraint.
-
Understand service dependencies
Dependency graphs generated from traces can show the interactions between services. Recognising these interactons can help identify how services depend on each other, detect circular dependencies or show excessive coupling.
Summary and next steps
With MicroProfile Telemetry 2.0, you can observe microservices to address issues and optimize performance through traces, metrics and logs.
To find out more, visit the Open Liberty documentation.


