Tracing your microservices made easy with MicroProfile Telemetry 1.0

Microservice architecture can make it more difficult to see how services depend on or affect other services, which also makes it harder to find the source of latency or inaccuracy. MicroProfile Telemetry helps you collect data on the paths that application requests take through services.
One way to increase observability of an application is by emitting traces. OpenTelemetry is a set of APIs, SDKs, tooling, and integrations that are designed for the creation and management of telemetry data such as traces, metrics, and logs. MicroProfile Telemetry 1.0 adopts OpenTelemetry tracing so your MicroProfile applications benefit from both manual and automatic traces!
Let’s start with the key concepts involved in distributed tracing:
- Traces
-
Traces represent requests and consist of multiple spans.
- Spans
-
Spans are representative of single operations in a request. A span contains a name, time-related data, log messages, and metadata to give information about what occurs during a transaction.
- Context
-
Context is an immutable object contained in the span data to identify the unique request that each span is a part of. This data is required for moving trace information across service boundaries, allowing developers to follow a single request through a potentially complex distributed system.
- Exporters
-
Exports are components that send data to a backend service so you can visualise and monitor the generated spans.
You can export the data that MicroProfile Telemetry 1.0 collects to Jaeger or Zipkin. OpenTelemetry also provides a simple logging exporter so that you can check whether spans are created by viewing the data in your console. This exporter can be helpful for debugging.
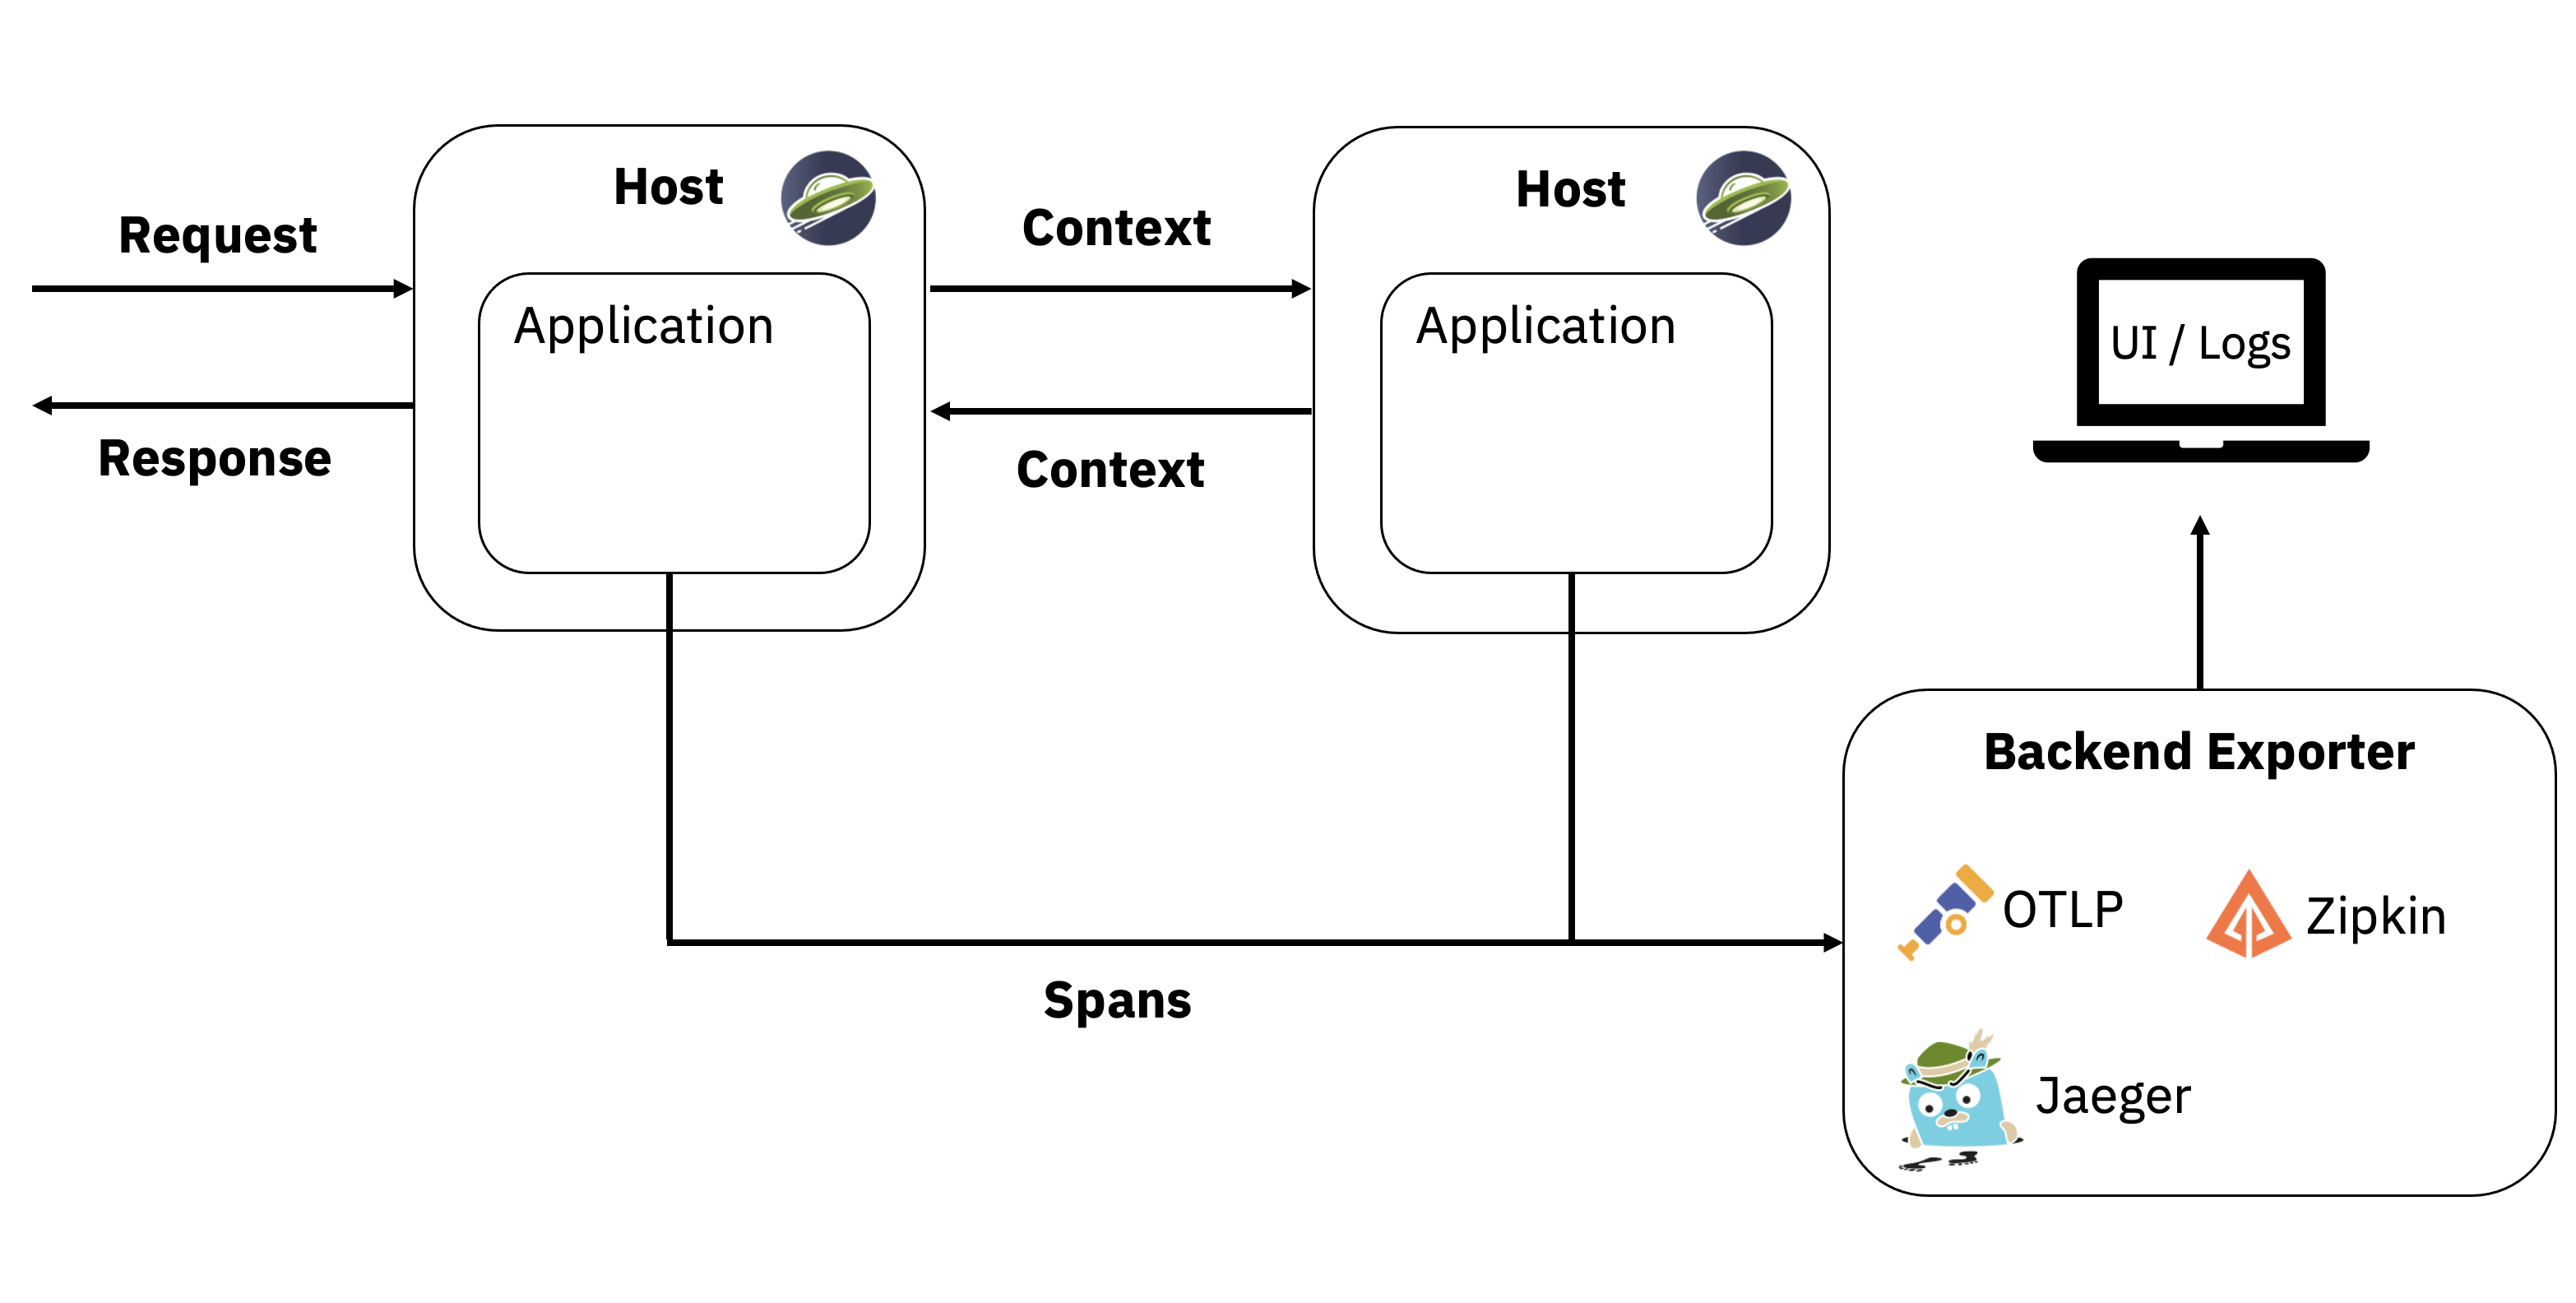
The following diagram shows a system that consists of two services that both have applications running on Open Liberty. With MicroProfile Telemetry 1.0 installed, the requests and responses generate spans and the paths between the services are monitored using their context. The spans are then exported to dedicated backend services where they can be viewed in a user interface or the console logs.
There are multiple ways that you can collect this data: automatic instrumentation, manual instrumentation, and the Open Telemetry Java Agent.
In this post, we’ll use a simple demo application to show you how to collect traces from multiple services. Check out the code in the following repository:
Before we get started, let’s get the backend set up. To use Jaeger, follow the Jaeger Getting Started instructions. If you would rather use Zipkin, you can follow the Zipkin Quickstart.
Automatic instrumentation
MicroProfile Telemetry 1.0 allows you to observe traces without modifying source code in your Jakarta RESTful web service (aka JAX-RS) applications.
As you can see in the system service in the demo application, you can enable mpTelemetry-1.0 in your server.xml:
<featureManager>
  <feature>mpTelemetry-1.0</feature>
</featureManager>
By default, MicroProfile Telemetry tracing is off. To enable any tracing aspects, specify otel.sdk.disabled=false as a MicroProfile Config property or OTEL_SDK_DISABLED=false as an environment variable for your server. This property is enabled in the demo microprofile-config.properties file along with the exporter configuration.
For more information on these properties, see OpenTelemetry’s configuration documentation.
To begin, open a new command-line session and navigate to the system directory:
cd system
Start the system service:
mvn liberty:run
Navigate to the system properties endpoint:
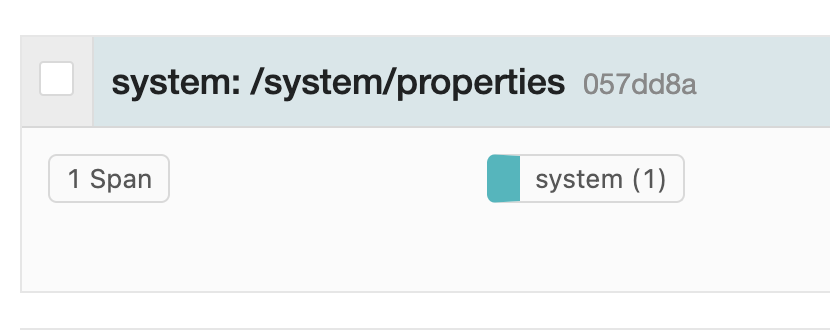
A span for this request will be automatically created by MicroProfile Telemetry. Check for the span in your chosen exporter’s endpoint. For example:
You just collected traces using automatic instrumentation! However, you might want to annotate selected methods or collect custom telemetry data. It’s now time to modify source code to add more data to your spans.
Manual instrumentation
Automatic instrumentation only instruments Jakarta RESTful web service applications. To get further spans on other operations, such as database calls, you can add manual instrumentation to the source code.
Prerequisites
Before instrumenting your code, the following prerequisites are required:
-
Third-party APIs must be made visible for your application in the server.xml:
<webApplication location="demo-microprofile-telemetry-inventory.war" contextRoot="/">
    <!-- enable visibility to third party apis -->
    <classloader apiTypeVisibility="+third-party"/>
</webApplication>-
The OpenTelemetry API and OpenTelemetry Instrumentation Annotations must be provided as dependencies to your build path. For example, with Maven, we add the following to the
pom.xmlfile.
<dependency>
    <groupId>io.opentelemetry</groupId>
    <artifactId>opentelemetry-api</artifactId>
    <version>1.19.0</version>
</dependency>
<dependency>
    <groupId>io.opentelemetry.instrumentation</groupId>
    <artifactId>opentelemetry-instrumentation-annotions</artifactId>
    <version>1.19.0-alpha</version>
</dependency>
Manual instrumentation of application code
Now you are all set to instrument your code to manually create traces. We start by injecting a Tracer and Span object:
@Inject
Tracer tracer;

@Inject
Span getPropertiesSpan;
This can then be used to create spans. For example, a span called GettingProperties starts and an event is added before the system service is called:
getPropertiesSpan = tracer.spanBuilder("GettingProperties").startSpan();
Properties props = manager.get(hostname);
try(Scope scope = getPropertiesSpan.makeCurrent()){
    ...
    getPropertiesSpan.addEvent("Received properties");
}
finally{
    getPropertiesSpan.end();
}
You can also create new spans by annotating methods in any Jakarta CDI beans using @WithSpan. The InventoryManager.java file in the demo application creates a span when a new system is added to the inventory. The hostname method parameter is annotated with the @SpanAttribute annotation to indicate that it is part of the trace:
@WithSpan
public void add(@SpanAttribute(value = "hostname") String hostname, Properties systemProps) {
    ...
}
A span created using the @WithSpan annotation can be given a name. For example, this span is given the name list:
@WithSpan("list")
public InventoryList list() {
    ...
}
Now that you created the spans manually, we can build the inventory service and deploy it to Open Liberty:
cd inventory
mvn liberty:run
Navigate to the inventory endpoint:
You should see five spans in the exporter’s endpoint: four spans from inventory and one span from system, as shown in the following example:
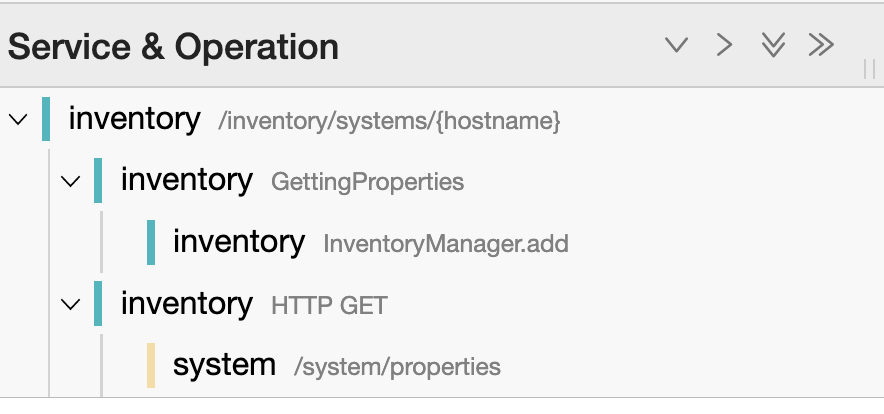
These spans are all part of one single trace that is emitted from the request to the endpoint. It is therefore easier to identify the source of inaccuracy or latency in a single request by debugging spans individually.
For more information, see OpenTelemetry’s manual instrumentation documentation.
Java agent instrumentation
Open Telemetry Java Agent enables Java applications to generate and capture telemetry data automatically using a JAR that can be attached to any Java 8+ application. Out-of-the-box tracing is provided for many libraries.
You can attach the JAR by adding the following to your pom.xml:
<!-- Plugin to package opentelemetry java agent -->
<plugin>
    <groupId>org.apache.maven.plugins</groupId>
    <artifactId>maven-dependency-plugin</artifactId>
    <version>3.3.0</version>
    <executions>
        <execution>
            <id>copy</id>
            <phase>package</phase>
            <goals>
                <goal>copy</goal>
            </goals>
        </execution>
    </executions>
    <configuration>
        <artifactItems>
            <artifactItem>
                <groupId>io.opentelemetry.javaagent</groupId>
                <artifactId>opentelemetry-javaagent</artifactId>
                <version>1.19.0</version>
                <type>jar</type>
                <outputDirectory>src/main/liberty/config</outputDirectory>
                <destFileName>opentelemetry-javaagent.jar</destFileName>
            </artifactItem>
        </artifactItems>
    </configuration>
</plugin>
You can then run Maven with the package goal, which copies the OpenTelemetry Java Agent into your server config:
mvn package
Add the following line to your jvm.options file, along with the agent configuration:
-javaagent:opentelemetry-javaagent.jarThe following limitations apply to using the agent to trace services:
Configuration
-
Configuration is shared between all applications deployed to the server.
-
Configuration properties are not read using MicroProfile Config and instead are only read from system properties and environment variables.
-
The agent reads its configuration very early in the startup process so system properties are not read from
bootstrap.properties.
SPI extensions
-
SPI-Extensions within applications will be ignored. See the agent documentation for providing SPI extensions.
Annotations
-
The agent instruments rest calls and methods annotated with
@WithSpan. Therefore, the created spans may be slightly different to those you would see with MicroProfile Telemetry’s manual instrumentation.
Library instrumentation
-
Open Liberty uses many open source libraries internally. Some of these might be instrumented automatically by the agent.
The agent creates and configures a global OpenTelemetry object using environment variables and system properties. Therefore, configuration is not read from MicroProfile Config.
For more information about MicroProfile Telemetry, see:


