Forwarding Open Liberty logs in OpenShift to Splunk by using the Log Forwarding API


Collecting logs in a single location helps you monitor all of your applications efficiently, which is especially important in highly distributed and dynamic container orchestration systems. Red Hat OpenShift Container Platform (OpenShift) provides a built-in log aggregation solution that uses Elasticsearch, Fluentd, and Kibana, also known as the EFK stack. In addition to the EFK stack, you can use the Log Forwarding API to send logs from an OpenShift cluster to other log analysis solutions. The Log Forwarding API is available starting with OpenShift 4.6, and in OpenShift 4.3 to 4.5 as a Technology Preview feature.
Splunk is one of the most popular log analysis solutions. If you want to start using Splunk as your logging solution for Open Liberty on OpenShift, you must first integrate OpenShift with Splunk. The Log Forwarding API simplifies OpenShift cluster integration with Splunk. You can configure custom pipelines to send logs to endpoints that are either inside or outside of your OpenShift cluster.
To send logs from OpenShift to Splunk, the Log Forwarding API must first send them to a Fluentd server. This blog post walks you through configuring the Log Forwarding API on your OpenShift cluster to forward your logs to a Fluentd and Splunk deployment that is external to your cluster. We also cover the configuration and deployment of the Fluentd and Splunk server on an external machine. The Fluentd server redirects the forwarded logs to Splunk by using Splunk’s HTTP Event Collector (HEC) API. In the final sections, you integrate your Open Liberty logs with the Fluentd forwarder and access the logs in Splunk. If JSON logging is enabled for Open Liberty, you can also work with your logs by using a dashboard that is provided by the Open Liberty team.
If you would rather set up the Log Forwarding API, Fluentd forwarder, and Splunk locally within your OpenShift cluster, see Forwarding Logs to Splunk Using the OpenShift Log Forwarding API on the OpenShift blog. After you complete those steps, proceed to the Integrating Open Liberty Logs and Viewing logs in Splunk sections of this blog post to complete your setup.
Before you begin
-
Ensure that your cluster logging instance is created and all pods are fully operational. For more information, see the Deploying cluster logging documentation for your OpenShift version.
Note: The cluster logging instance sample that is provided in the OpenShift documentation leaves the storage class value for the reader to configure. In test environments, you can omit the storage section and the cluster logging instance uses in-memory storage. However, this configuration is not suitable for production.
-
Optional: It is recommended that you secure the connection between the Fluentd servers on your OpenShift cluster and the external Fluentd server. This step creates a secret that is used by the Log Forwarding API to achieve a secure connection. This procedure assumes that the necessary key and certificate files, for example
tls.crtandtls.key, are already created. The instructions for creating the keys and certificates are not within the scope of this blog post. The key and certificate are also used when you deploy the external Fluentd server.-
Switch to the
openshift-loggingprojectoc project openshift-logging -
Create a secret that contains your key and certificate. You also need to specify a shared_key, which is a string password that is used as an extra layer of authentication between the Fluentd servers on the OpenShift cluster and the external Fluentd server. The examples in this blog post use secure-forward for the secret name and "secretpassword" for the shared key. Change the paths in the following example as necessary:
oc create secret generic secure-forward --from-file=ca-bundle.crt=/path/to/tls.crt --from-file=tls.crt=/path/to/tls.crt --from-file=tls.key=/path/to/tls.key --from-literal=shared_key=secretpassword
-
Configuring the Log Forwarding API
-
Create the
log-forward-instance.yamlfile. Configure the outputs and pipelines.-
The
outputssection of the file specifies where to send the logs. To establish a secure connection to an output, you must specify a secret, such as the one that you created in step 2b of the Before you begin section. If you want to use an insecure connection for test purposes, you can omit the secret from your output configuration. -
The
pipelinessection of the file specifies which log types are sent to the configured outputs.The following sample
log-forward-instance.yamlfile defines twooutputs: a secure connection to a Fluentd server namedfluentd-server-secureand an insecure connection to another Fluentd server namedfluentd-server-insecure. Note the different protocols that are defined for the url in each output (tls vs tcp). Remove the output type and corresponding pipeline outputRef that you do not want to use in your file. Each log type and its corresponding output reference is defined in thepipelinessection. Thedefaultoutput reference points to the internal OpenShift Container Platform Elasticsearch instance:apiVersion: logging.openshift.io/v1 kind: ClusterLogForwarder metadata: name: instance namespace: openshift-logging spec: outputs: - name: fluentd-server-secure type: fluentdForward url: 'tls://fluntdserver.security.example.com:24224' # Substitute with FQDN or IP address secret: name: secure-forward - name: fluentd-server-insecure type: fluentdForward url: 'tcp://fluntdserver.home.example.com:24224' # Substitute with FQDN or IP address pipelines: - name: container-logs inputRefs: - application outputRefs: - default - fluentd-server-secure - fluentd-server-insecure - name: infra-logs inputRefs: - infrastructure outputRefs: - default - name: audit-logs inputRefs: - audit outputRefs: - defaultFor more information, see Forwarding logs using the Fluentd forward protocol. Make sure to consult the documentation for your version of OpenShift, as the pipeline configuration for version 4.6 is slightly different from the preceding versions.
-
-
Create the Log Forwarding instance inside your OpenShift cluster:
[root@ocp ~]# oc create -f log-forward-instance.yaml -
OpenShift 4.3 to 4.5 only: Annotate the ClusterLogging instance to enable the Log Forwarding API.
[root@ocp ~]# oc annotate clusterlogging -n openshift-logging instance clusterlogging.openshift.io/logforwardingtechpreview=enabled -
To check whether the logs are forwarded to the specified outputs, run the following command:
[root@ocp ~]# oc -n openshift-logging get cm fluentd -o json | jq -r '.data."fluent.conf"' > fluentd-with-logfowarding.confThis command displays the ConfigMap configuration for Fluentd inside OpenShift. Check whether the outputs are defined inside the configuration file.
-
In the following ConfigMap file example, the
FLUENTD-FORWARDoutput type is specified for theCONTAINER_LOGSpipeline:... <label @CONTAINER_LOGS> <match **> @type copy <store> @type relabel @label @DEFAULT </store> <store> @type relabel @label @FLUENTD_FORWARD </store> </match> </label> ...OpenShift 4.3 to 4.5 only: The
@label @DEFAULTvalue is replaced by@label @ELASTICSEARCH.
-
Configuring Splunk and Fluentd
When you specify the forward output in your log-forward-instance.yaml file, you can forward OpenShift logs to Splunk by using the Fluentd forward protocol. You can set up Splunk inside your OpenShift Cluster or on your external machine.
Setting up Splunk and Fluentd on your external machine
The following instructions explain how to manually set up Splunk and Fluentd on your external machine. If Splunk is already deployed on your external machine, this option helps you set up the connection between your OpenShift cluster and Splunk. To receive logs from Fluentd inside your OpenShift cluster, you must deploy both Splunk and an instance of Fluentd on your external machine. For the purposes of this setup demo, Docker compose is used for installation and the external deployment of Fluentd and Splunk.
-
Create the following directories to hold the necessary files:
/path/to/fluentdSplunkDir
/path/to/fluentdSplunkDir/fluentd
/path/to/fluentdSPlunkDir/fluentd/conf
/path/to/fluentdSPlunkDir/fluentd/secret
-
Create a
Dockerfilefile under the/path/to/fluentdSplunkDir/fluentddirectory to install essential packages while you build the Fluentd Docker image. You need to install the build-essential package to install all dependencies and the fluent-plugin-splunk-enterprise package to forward the logs to Splunk.-
Sample
Dockerfile:# fluentd/Dockerfile FROM fluent/fluentd:v1.10-debian user 0 RUN apt-get update -y RUN apt-get install build-essential -y RUN fluent-gem install fluent-plugin-splunk-enterprise -v 0.10.0
-
-
Optional: If you are configuring a secure connection between your external Fluentd server and the Fluentd servers from your OpenShift cluster, move the
tls.keyandtls.crtfiles that you created earlier to the/path/to/fluentdSplunkDir/secretdirectory.
-
Create the
docker-compose.yamlfile under the/path/to/fluentdSplunkDirdirectory for Fluentd and Splunk deployment on your external machine.-
Sample
docker-compose.yaml:version: '3' services: splunk: hostname: splunk image: splunk/splunk:latest environment: SPLUNK_START_ARGS: --accept-license SPLUNK_ENABLE_LISTEN: 8088 SPLUNK_PASSWORD: changeme ports: - "8000:8000" - "8088:8088" fluentd: build: ./fluentd volumes: - ./fluentd/conf:/fluentd/etc - ./fluentd/secret:/fluentd/secret # remove if not using a secure connection links: - "splunk" ports: - "24224:24224" - "24224:24224/udp"Configure the ports for Splunk and Fluentd. You can also define a splunk password under splunk: environment.
-
-
Create
fluent.conffile in the/path/to/fluentdSplunkDir/fluentd/conf/directory to configure Fluentd.The following
fluent.conffile uses a secure connection between OpenShift Fluentd servers:<source> @type forward port 24224 <transport tls> cert_path /fluentd/secret/tls.crt private_key_path /fluentd/secret/tls.key </transport> <security> self_hostname fluentd shared_key secretpassword </security> </source> <match kubernetes.**> @type splunk_hec host splunk port 8088 token 00000000-0000-0000-0000-000000000000 # substitute with token default_source openshift use_ssl true ssl_verify false # skips SSL certificate verification #ca_file /path/to/ca.pem flush_interval 5s </match>-
The source directive determines the input sources. It uses the forward type to accept TCP packets from your OpenShift instance.
-
port indicates the port that the Fluentd server is listening to for data
-
The transport section with the tls parameter enables a secure TLS connection between this Fluentd server and fluentd servers in the OpenShift cluster.
-
The cert_path and private_key_path parameters are the keys and certificates that are mounted into the Fluentd docker image.
-
-
The security section is used for additional authentication
-
The self_hostname parameter is a required key that indicates the name of the host. This sample uses fluentd.
-
The shared_key parameter connects the Fluentd servers by using password authentication. This example uses secretpassword as the password.
-
If you choose to use an insecure connection between the Fluentd servers in the OpenShift cluster and this Fluentd server, you can use the following simplified source configuration instead:
<source>
  @type forward
  port 24224
</source>
-
-
-
-
The match directive determines the output destinations. It looks for events with matching tags and uses splunk_hec to send the events to Splunk by using HTTP Event Collector.
-
The Splunk host value is required. We are using "splunk" for the host, as defined in the
docker-compose.yml. -
The Splunk port value is required. We are using port
8088, as defined in thedocker-compose.yml. -
Replace token with the Splunk generated token. This token is obtained later in step 7.
-
The default_source parameter sets the value as source metadata.
-
Set the use_ssl parameter to true to use SSL when you connect to Splunk. By default, the Splunk deployment enables SSL for incoming HEC connections.
-
The ssl_verify parameter is set to false to avoid SSL certificate verification. Since both the Fluentd and Splunk images are deployed on the same machine, this blog post uses an insecure connection. To secure your connection with Splunk, configure a certificate for your splunk deployment, load it into your Fluentd image, and point to it with the ca_file option. These steps are beyond the scope of this blog post.
See the Fluentd documentation for the forward input plugin for more configuration options.
The Fluentd image that is used in this blog post has Fluent’s Splunk HEC output plugin installed. See the Splunk HTTP Event Collector Output Plugin documentation for more configuration options.
-
-
-
Deploy Splunk by running the following command:
[root@ocp ~]# docker-compose up splunk -
Create the Splunk HTTP Event Collector data input token. Visit Splunk at
http://localhost:8000and log in withadminand the password that is specified in yourdocker-compose.yamlfile. Go to Settings > Data Inputs > HTTP Event Collector > New Token. SetNameas "openshift" and click Next. In Input Settings, setSource Typeas "Automatic" andApp Contextas "Search & Reporting (search)". UnderIndex, clickCreate a new indexand setIndex Nameas "openshift".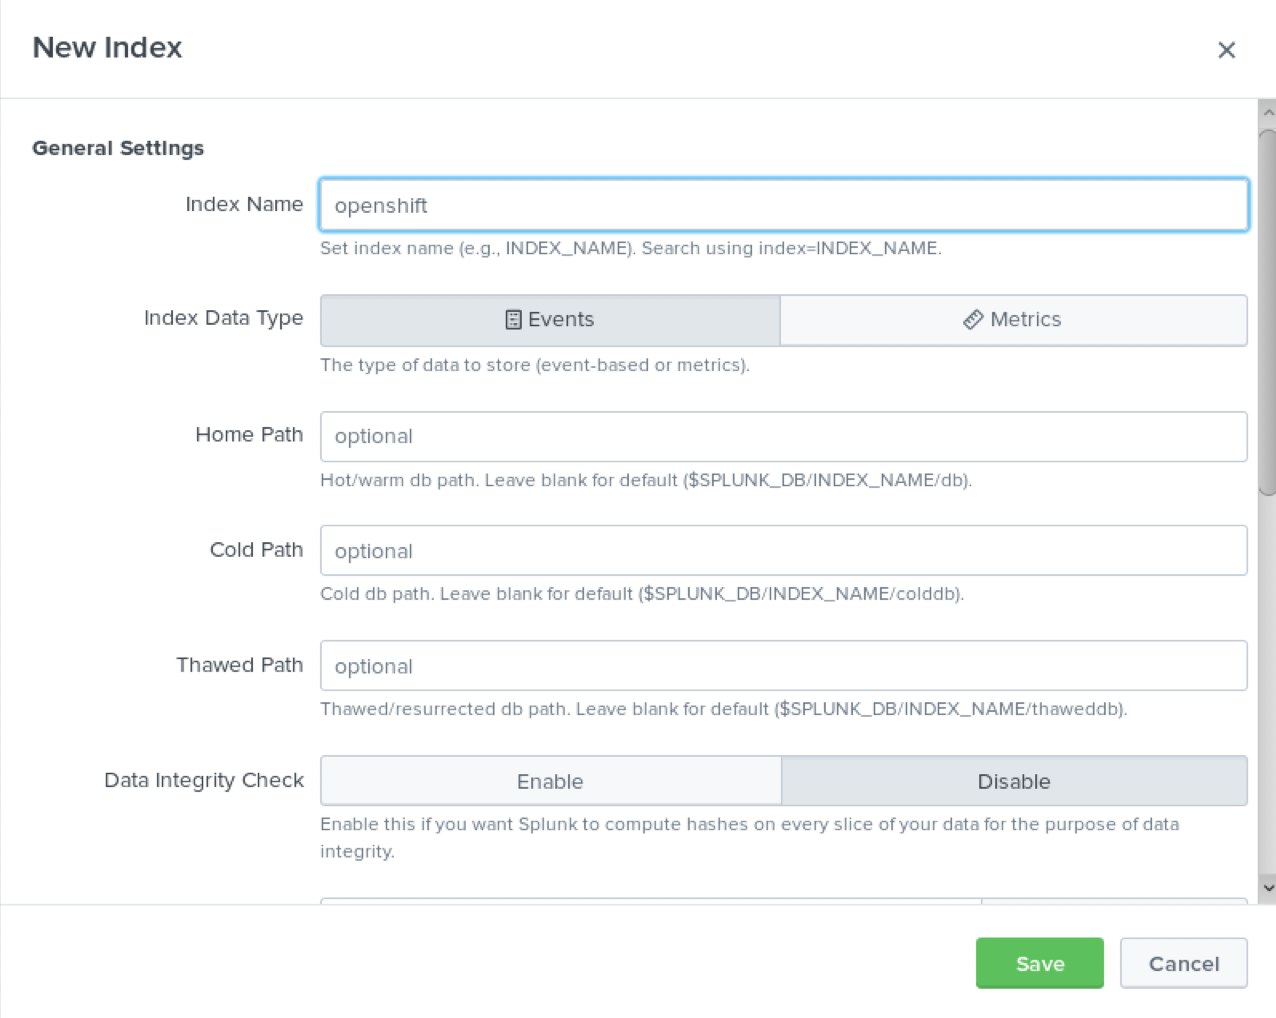
Select the "openshift" index in the
Available item(s)box to move the index into theSelected item(s)box.
Proceed to the
Reviewsection and submit. Copy the generated token value to use in the fluent.conf file.
-
Deploy Fluentd by running the following command:
[root@ocp ~]# docker-compose up fluentd
Integrating Open Liberty Logs
Open Liberty can emit logs to standard out, or in Liberty terms console output, in either JSON or simple (plain text) format. The OpenShift platform consumes and redirects these logs to configured destinations. When emitting logs in simple format, only message logs are included and the output is intended for human consumption. With JSON formatted output, you can configure any type of log to output, such as message logs, trace logs, ffdc logs, access logs, and audit logs. The intention of JSON formatted logs is to consolidate all the logging data into a single stream and in a mapped format. This logging strategy is optimized for a containerized environment. Ultimately, JSON formatted logs allow for the log data to be easily indexed and queried by downstream monitoring tools. For example, the JSON data can be used to create meaningful visualizations on log analysis dashboards. The Open Liberty team provides publicly available dashboards for Kibana and Splunk, but you can modify or create your own dashboards to your monitoring needs. Although you can use Kibana or Splunk without JSON logging, your querying capabilities are limited because you are not able to use all log types and data.
For more information about Open Liberty logging, see the Open Liberty logging and tracing documentation. For specifics regarding JSON logging, see the Open Liberty JSON logging documentation. Also, see the JSON log events reference list for a complete index of available fields for the different log types.
Note that JSON logging is configured by default with all log types enabled if you are deploying Open Liberty through the Open Liberty Operator. See the Open Liberty Operator documentation for more information on how to configure the operator to suit your needs.
Configuring OpenShift to parse Open Liberty JSON logs
If you do not intend to use Open Liberty JSON logging to leverage the use of dashboards then you may proceed to Viewing logs in Splunk.
In OpenShift, the cluster logging Fluentd collectors capture the container logs and set each log into a message field of a Fluentd JSON document. This JSON is sent to their destination log consumer. To properly use Open Liberty JSON log data in a dashboard, you must configure the Fluentd collectors to merge nested JSON data to the parent JSON payload. Enabling Fluentd to merge JSON logs can cause problems if JSON fields from different products or applications use the same JSON field names to represent different data types. These problems occur because Elasticsearch uses the first occurrence of a field to determine the data types corresponding to that field name. If multiple deployments generate JSON logs with the same fields, but are of different data types, merging the JSON data can potentially lead to data loss in your Elasticsearch index. Review your OpenShift configuration to determine whether the potential impact poses a risk to your environment. The following steps are required to enable merging of nested JSON fields.
-
Change the cluster logging instance’s
managementStatefield from "Managed" to "Unmanaged":[root@ocp ~]# oc edit ClusterLogging instance apiVersion: "logging.openshift.io/v1" kind: "ClusterLogging" metadata: name: "instance" .... spec: managementState: "Unmanaged"Alternatively, you can modify this file on the web console. Ensure you are in the
openshift-loggingproject namespace and go toAdministration > Custom Resource Definitions > ClusterLogging > Instances > Instance > YAML. Change themanagementStatefield from "Managed" to "Unmanaged".
-
In the Fluentd ConfigMap, change the
merge_json_logattribute of thekubernetes.var.log.containers.**filter totrue.If you are running on OpenShift 4.3 to 4.5, this step is slightly different. Skip to the line that says OpenShift 4.3 to 4.5 only.
[root@ocp ~]# oc edit configmap fluentd

apiVersion: v1
data:
...
  <filter kubernetes.var.log.containers.**>
    @type parse_json_field
    merge_json_log 'true'
    preserve_json_log 'true'
    json_fields 'log,MESSAGE'
  </filter>
...
Alternatively, you can modify this file on the web console. Ensure you are in the
openshift-loggingproject namespace and go toWorkloads > Config Maps > fluentd > YAML. Change the value for themerge_json_logattribute of thekubernetes.var.log.containers.**filter to true.OpenShift 4.3 to 4.5 only: Instead of manually changing the ConfigMap, run the following command:
[root@ocp ~]# oc set env ds/fluentd MERGE_JSON_LOG=true
-
Force restart the Fluentd pods to pick up the change by running the following command:
oc delete pod --selector logging-infra=fluentd
Note: After you set the managementState to "Unmanaged" in the ClusterLogging instance, any further changes to the ClusterLogging or ClusterLogForwarder instances are not automatically detected. If you need to modify the configuration for either instance, you must change the managementState field back to "Managed". However, after the managementState is changed to "Managed", the ClusterLogging instance reverts the Fluentd ConfigMap back to its original settings. You must complete the previous steps again to re-enable Fluentd to parse JSON.
Viewing logs in Splunk
To view the logs that are forwarded from the OpenShift platform go to Search & Reporting. Search for index="openshift" to view logs from OpenShift Container Platform.
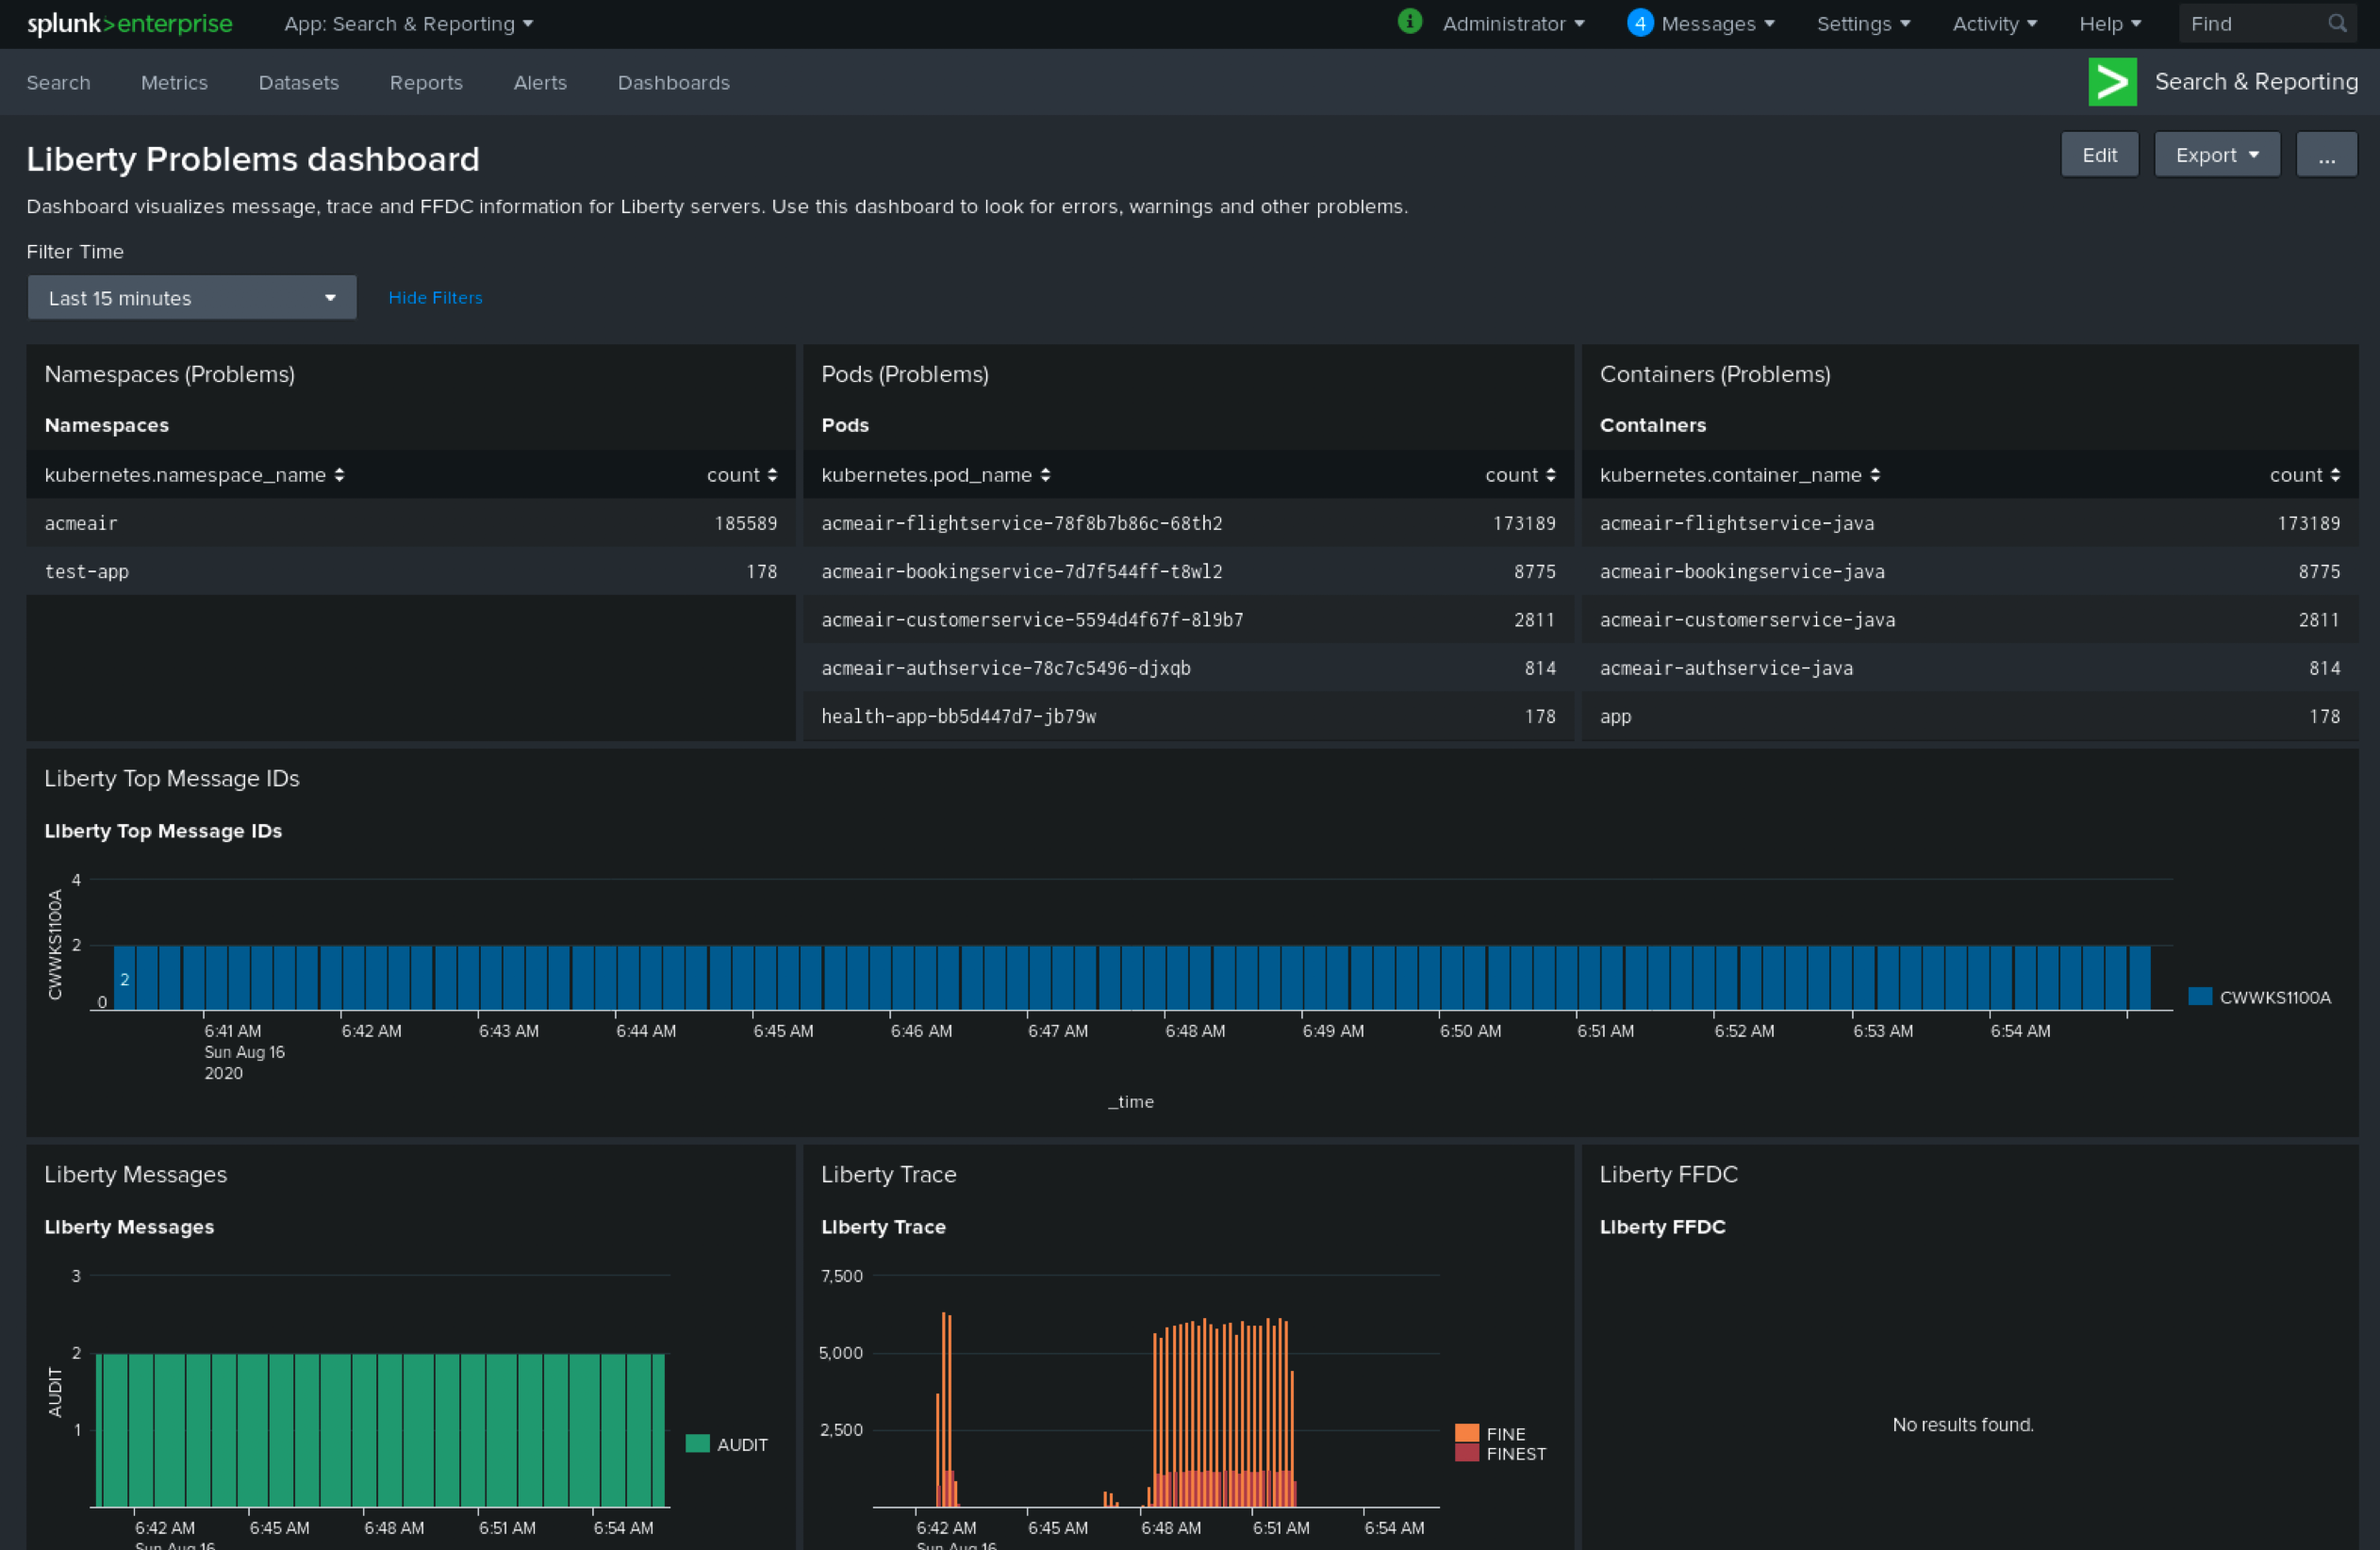
If you configured Open Liberty with JSON logging and the OpenShift Fluentd collectors to parse the JSON logs you can use the Open Liberty Splunk dashboards.
-
Under the Search & Reporting view, go to the Dashboards tab, click
Create New Dashboard, and give it a name, for example,Liberty Problems Dashboard.
-
Import the downloaded sample dashboards by using the Source option. Using this dashboard, you can visualize message, trace, and first failure data capture (FFDC) logging data that is collected from JSON logging in Open Liberty.
Troubleshooting
If no logs are present on Splunk when you are done configuring, the following approaches can help diagnose the issue.
Connection between Fluentd and Splunk
-
Ensure that the Splunk HEC token is correct
-
Check the container logs from the Fluentd instance and the Splunk instance for warnings or errors
Connection between the OpenShift cluster and the Fluentd instance
-
Ensure that the IP/FQDN of the machine that is hosting Fluentd and Splunk is accessible from the OpenShift cluster.
-
(Security) Ensure that you are using the correct key and certificates for both the OpenShift secret and the Fluentd instance.
-
(Security) Ensure that you are using the correct
shared_keyvalue for both the OpenShift secret and the Fluentd instance. -
Check the logs for the Fluentd pods that are running under the
openshift-loggingnamespace for warnings or errors.
Conclusion
Application logging helps you easily retrieve and analyze problems on your servers. With the Log Forwarding API, you can use existing external enterprise log collection solutions for OpenShift logs. This post demonstrates how Splunk can help you to aggregate and analyze log events from Open Liberty servers that are running on OpenShift.


