
When we ask our users which log analysis tool they use with Open Liberty, one of the most common responses is Splunk. Collecting log data from running servers in one place and monitoring, searching, and visualizing those logs in real time helps you find and troubleshoot problems faster. Splunk captures, indexes, and correlates real-time data in a searchable repository, from which it can generate graphs, reports, alerts, dashboards, and visualizations. It provides an engine that helps you monitor, search, analyze, and visualize your log events.
There are many tools available to aggregate and analyze the log events of your application, and each of them have their own benefits for particular use cases. Splunk provides an Event Collector, which easily and securely sends data and application events and logs over HTTP/HTTPS from Docker containers to a Splunk deployment. Open Liberty can emit logging events to standard-out/console in JSON format, which is easy for monitoring stacks such as Splunk to monitor.
Docker uses a logging mechanism called logging drivers to help facilitate log aggregation from running containers. Splunk provides its own logging driver, which sends container logs to Splunk using the HTTP Event Collector (HEC), introduced in Splunk 6.3. In this blog post, we’ll use Splunk to analyze logs from an Open Liberty Docker container.
Setting up the Splunk Enterprise Docker image
First, ensure that you have Docker version 1.10 or higher installed. For this example, we’ll use the free Splunk Enterprise Docker image to run Splunk.
-
Pull the latest Splunk Enterprise Docker image, from DockerHub. Ensure the Splunk version is 6.3 or later to have the HTTP Event Collector support.
docker pull splunk/splunk
-
Run the Splunk image to start the Splunk server with the following command:
docker run -d -p 8000:8000 -p "8088:8088" -e "SPLUNK_START_ARGS=--accept-license" -e "SPLUNK_USER=admin" -e "SPLUNK_PASSWORD=passw0rd" --name splunk splunk/splunk:latest
Expose port mapping for port 8000 for the Splunk Web Interface UI and port 8088 for Splunk’s HTTP Event Collector and its services. Use the SPLUNK_USER and SPLUNK_PASSWORD environment variables to specify your custom username and password.
-
Access the Splunk Web Interface UI with the following URL, in a web browser.
http://localhost:8000
Log in to the Splunk server with the username and password you specified in Step 2.
Configuring the HTTP Event Collector
HEC offers an efficient and secure way to send high volume events/data over HTTP/HTTPS directly to Splunk from a particular application or container. It is a token-based JSON API, so the Splunk credentials do not need to be hardcoded. The Splunk logging driver uses the HEC to collect your Docker logs, without needing a forwarder.
-
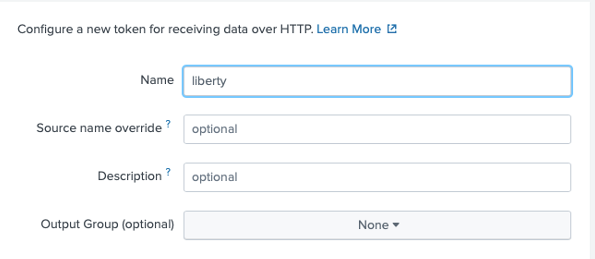
Create the Splunk HTTP Event Collector data input token. In the Splunk Web Interface, go to Settings → Data Inputs → HTTP Event Collector → New Token. Enter a name for the HTTP Event Collector and leave the other fields unchanged. In this example, we named the HEC "liberty". Click Next.
-
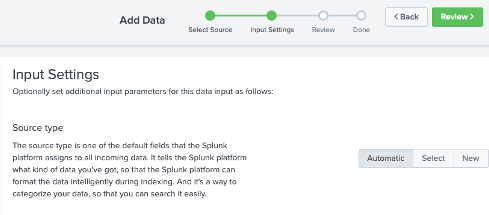
In the Input Settings, ensure the
Source typefield is set to “Automatic”. Leave the other fields unchanged and click Review.
-
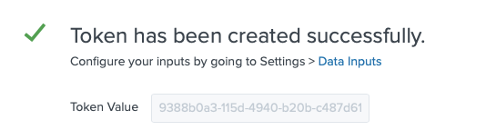
The HTTP Event Collector token is now created successfully. Take note of the generated Token Value for later use.
-
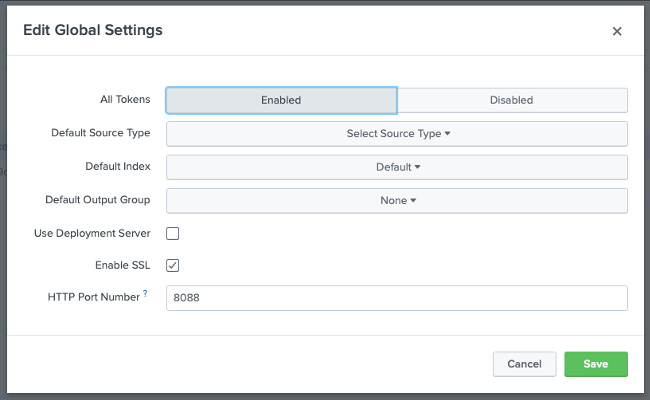
Ensure access to the HTTP Event Collector is enabled. Go to Settings → Data Inputs → HTTP Event Collector → Global Settings. In the
All Tokensfield, click Enabled and check the Enable SSL checkbox, if these options are not already selected. These options ensure the port 8088 for HTTP Event Collector is secured and is using the Splunk default certificate.
Running the Open Liberty Docker Image
For this example, we’ll use the Open Liberty Docker image to emit JSON logs to Splunk.
Use the following command to run the Open Liberty Docker image and start the Open Liberty server. This configures Open Liberty to emit JSON formatted logs and uses the Splunk logging driver with the HTTP Event Collector:
docker run -d -p 80:9080 -p 443:9443 --log-driver=splunk --log-opt splunk-url=https://localhost:8088 --log-opt splunk-token=<REPLACE_WITH_SPLUNK_HEC_TOKEN> --log-opt splunk-insecureskipverify=true --log-opt splunk-format=json -e WLP_LOGGING_CONSOLE_FORMAT=JSON -e WLP_LOGGING_CONSOLE_LOGLEVEL=info -e WLP_LOGGING_CONSOLE_SOURCE=message,trace,accessLog,ffdc,audit open-liberty:latestEnsure that for the log-opt splunk-token option, the <REPLACE_WITH_SPLUNK_HEC_TOKEN> value from this example command is replaced by the generated HEC token from Step 2 of the “Configuring the HTTP Event Collector” section.
The other log options configure Open Liberty to use the Splunk logging driver, specify the host of your Splunk Enterprise Docker container, and set the message format. The environmental variables set the console format, message granularity, and sources that route to the console. For more information about Open Liberty logging environment variables, see Logging and tracing.
Analyzing and visualizing the Open Liberty container logs in Splunk
You can now use the Splunk Web Interface UI to analyze the aggregated log data from the Open Liberty container.
In the Splunk Web Interface, navigate to App → Search & Reporting. Use the following query to search for all the log entries that are from the HTTP Event Collector named liberty, with the line. prefix removed from the interesting fields. The log events can be further filtered with the desired timeframe and the log information fields, as needed.
source="http:liberty" | rename line.* as *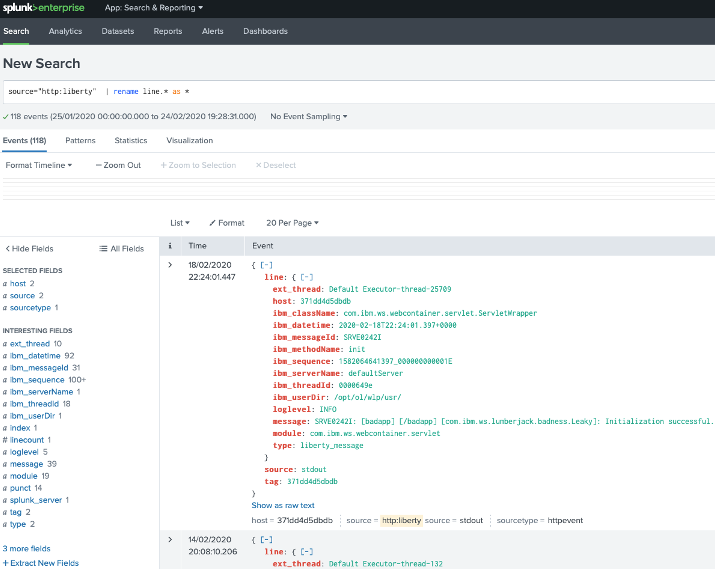
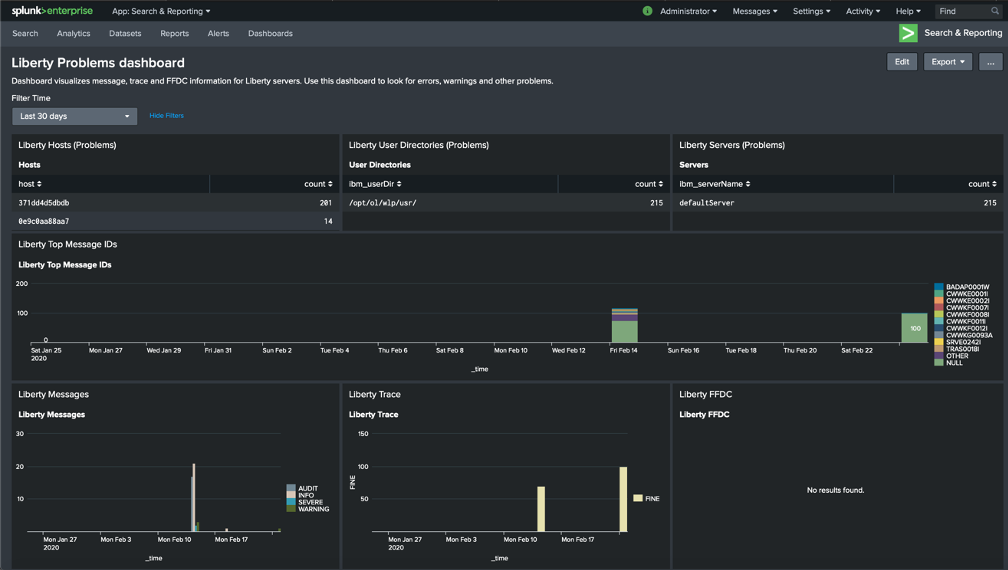
You can collect the aggregated log events from the Open Liberty Docker container into visualizations, which provide real-time information at a glance. I created a sample Open Liberty Splunk dashboard that you can download from GitHub. You can use this dashboard to visualize message, trace, and first failure data capture (FFDC) logging data collected from JSON logging in Open Liberty.
-
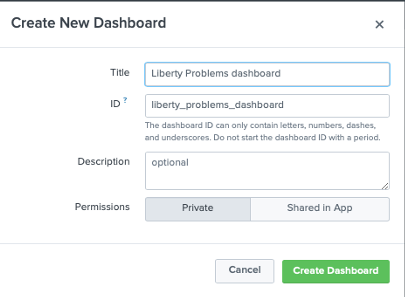
On the Search & Reporting page in the Splunk Web Interface, click on the Dashboards tab and click Create New Dashboard. In the pop-up window, enter a title for your dashboard and click Create Dashboard, leaving the remaining fields unchanged.
-
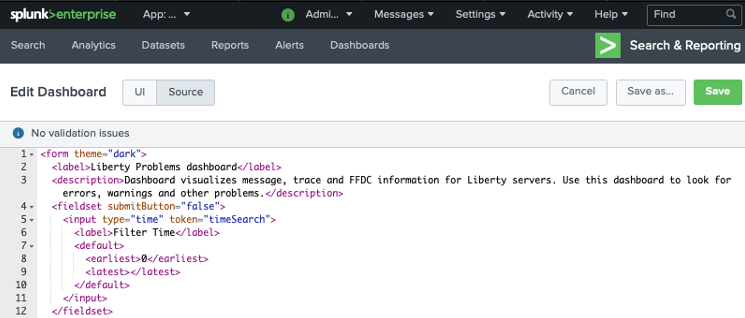
From the Dashboards Editor, click the Source tab and replace the contents of the source editor with the contents of the sample Open Liberty Splunk Dashboard that you downloaded in Step 1. Click Save.
-
You can now view a collection of visualizations for each message, trace, and FFDC logging event from the Open Liberty container. This provides real-time information about the running container. The Time Filter input can be modified to filter the log event data displayed on your dashboard according to your desired timeframe.
Conclusion
We have now seen how to aggregate the logs from Docker containers running Open Liberty and how to analyze and visualize them using Splunk. Splunk allows us to easily and securely aggregate and analyze logs from Docker containers, by making use of its HTTP Event Collector and the provided Splunk logging driver from Docker. Aggregating and analyzing your log events, and working with them in dashboards, helps you spot potential problems faster from your Open Liberty server and applications.


