Rapid application development with Gradle and dev mode on Open Liberty

Open Liberty development mode, or dev mode, now works with Gradle projects. Open Liberty dev mode allows you to develop cloud-native Java applications with any text editor or IDE by providing hot reload and deployment, on-demand testing, and debugger support. Your code is automatically compiled and deployed to your running server, making it easy to iterate on your changes. You can run tests on demand or even automatically so that you can get immediate feedback on your changes. You can also attach a debugger at any time to debug your running application.
In this post, we show how dev mode allows you to rapidly develop Java applications using Open Liberty and Gradle. We demonstrate this with an example scenario of enabling a MicroProfile health check endpoint in a REST microservice.
You can follow along using your own project or by cloning the demo-devmode sample project.
git clone https://github.com/OpenLiberty/demo-devmode.git
Including the Liberty Gradle plugin
For Gradle projects, dev mode is run through the Liberty Gradle plugin version 3.0 or above. If you are using the sample project, notice that the project defines the plugin in the project’s build.gradle file:
buildscript {
    repositories {
        mavenCentral()
    }
    dependencies {
        classpath 'io.openliberty.tools:liberty-gradle-plugin:3.0'
    }
}
Starting the application using dev mode
Start dev mode by running the following command in your project: gradle libertyDev. This starts the server in dev mode along with installing features and deploying your application.
Automatically recompiling and deploying to the running server
Once dev mode is started, source code changes are automatically compiled and deployed to the running server. If any features are added to the server.xml file, they are installed automatically.
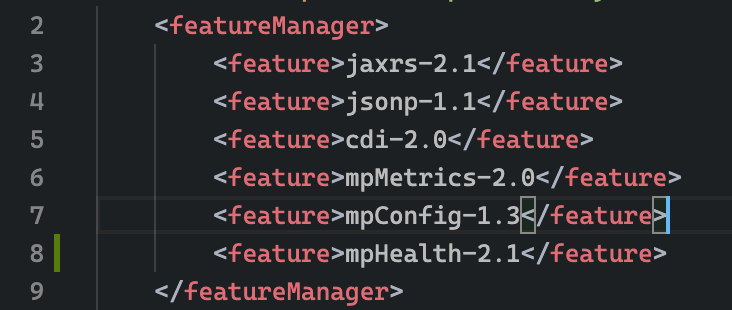
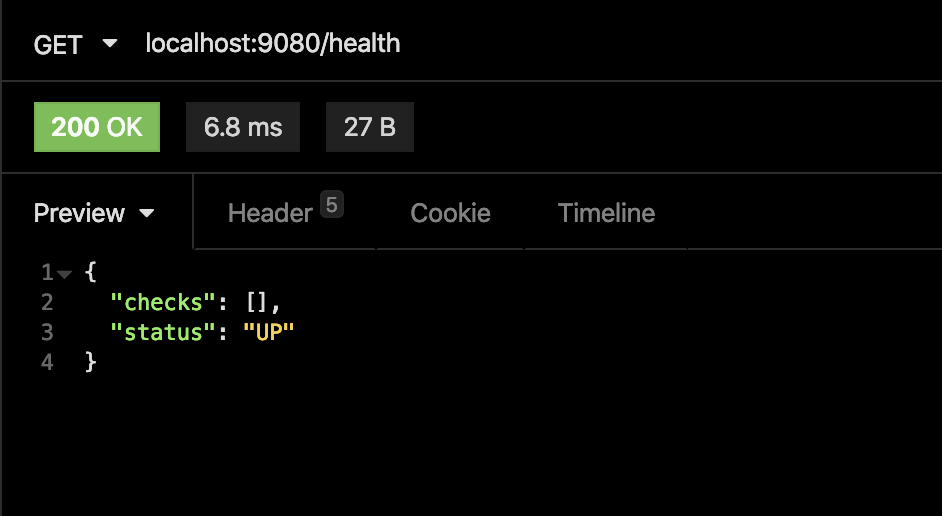
For example, adding the mpHealth-2.1 feature to server.xml to enable health checks makes the health endpoint accessible at http://localhost:9080/health.
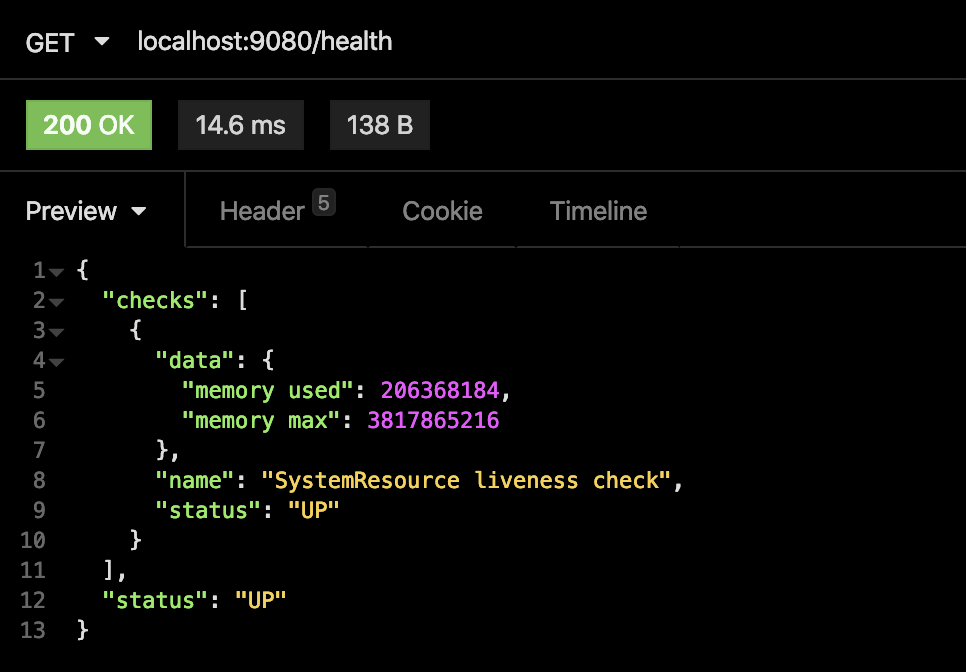
When you add code into your application for liveness checks, you can immediately see the updated result when you access the URL again:
package io.openliberty.sample.system;

import javax.enterprise.context.ApplicationScoped;

import java.lang.management.MemoryMXBean;
import java.lang.management.ManagementFactory;

import org.eclipse.microprofile.health.Liveness;
import org.eclipse.microprofile.health.HealthCheck;
import org.eclipse.microprofile.health.HealthCheckResponse;

@Liveness
@ApplicationScoped
public class SystemLivenessCheck implements HealthCheck {

    @Override
    public HealthCheckResponse call() {
        MemoryMXBean memBean = ManagementFactory.getMemoryMXBean();
        long memUsed = memBean.getHeapMemoryUsage().getUsed();
        long memMax = memBean.getHeapMemoryUsage().getMax();

        return HealthCheckResponse.named(
            SystemResource.class.getSimpleName() + " liveness check")
                                  .withData("memory used", memUsed)
                                  .withData("memory max", memMax)
                                  .state(memUsed < memMax * 0.9).build();
    }

}
Running tests automatically and on demand
Go to the console where you started dev mode, and press Enter. This runs the tests on a separate thread while dev mode is still active.
To run tests automatically after every change, include the --hotTests parameter when starting dev mode. For example: gradle libertyDev --hotTests
Attaching a debugger
At any point during dev mode, you can attach a Java debugger to debug your application. By default, the debug port is 7777, but another port can be used and shown in the console output if the default port is not available.
For example, to debug your MicroProfile health check, set a breakpoint inside the call() method and attach your IDE’s debugger to port 7777.
Visit http://localhost:9080/health and the IDE pauses at the breakpoint that you set, allowing you to debug.
Stopping dev mode
You can quit dev mode at any time by pressing CTRL+C in the terminal, or type q and press Enter.
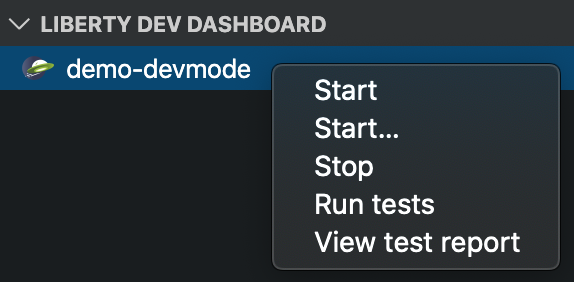
VS Code extension support
The Open Liberty Tools VS Code extension has also been updated to support Gradle projects. This optional extension lets you interact with dev mode entirely within VS Code. You can start Open Liberty in dev mode, make changes to your application while the server is up, run tests and view results, and even debug the application without leaving the editor.
For more information on the Open Liberty Tools VS Code extension, you can read about it in the Open Liberty dev mode with VS Code blog post.
Further reading
For more details on dev mode, see the documentation for the libertyDev task.


