Get alerts from your Open Liberty apps in Slack using Prometheus Alertmanager

Every application needs a strong monitoring system to catch unexpected issues, whether it’s an overloaded heap or a slow-responding servlet. MicroProfile Metrics provides the ability to expose metrics for your application. Used in conjunction with the open source monitoring system Prometheus and the Prometheus Alertmanager, we can build a strong foundation for monitoring your system and reacting quickly to issues.
In this post, we’ll set up Prometheus Alertmanager to fire alerts to a specified Slack channel to notify you when, for example, your app’s heap usage is too high. We’ll configure Prometheus with alerting rules to receive certain alerts from Open Liberty, then we’ll configure Prometheus Alertmanager to pass those alerts to a Slack channel.
Already familiar with Alertmanager? Check out a sample configuration for Open Liberty. The repository also contains the configuration used as an example in this blog post, if you get stuck along the way.
What you’ll need
Before we start, make sure your app is configured with an Open Liberty server with the mpMetrics-2.0 feature enabled.
Download and extract both Prometheus and Prometheus Alertmanager to your laptop. We’ll assume you know the basics of using Prometheus already.
You also need a Slack channel to send alerts to, as well as a Slack webhook for that channel.
Configure Prometheus to monitor metrics from Open Liberty
In this section, you’ll configure Prometheus to get metrics from Open Liberty. Then, you’ll set up alerting rules using PromQL queries to give the Alertmanager some alerts to send.
Set up Prometheus to communicate with Open Liberty
First, you’ll need to configure Prometheus to communicate with the Open Liberty server in your app so it can scrape metrics.
-
In your Prometheus installation directory, edit the
prometheus.ymlfile. Under thescrape_configssection, there is already a job configured for Prometheus itself. We need to add one for Open Liberty, which should look something like this:- job_name: 'openliberty' scheme: 'https' # If you have authentication enabled on your server, you need to give the username and password # Note that you can use <mpMetrics authentication='false'/> in your server.xml to disable authentication basic_auth: username: 'adminusername' password: 'adminpassword' tls_config: insecure_skip_verify: true static_configs: - targets: ['localhost:9443'] -
Run
./prometheus(orprometheus.exeon Windows). When you see the messageServer is ready to receive web requests, go tohttp://localhost:9090to view the Prometheus web UI. -
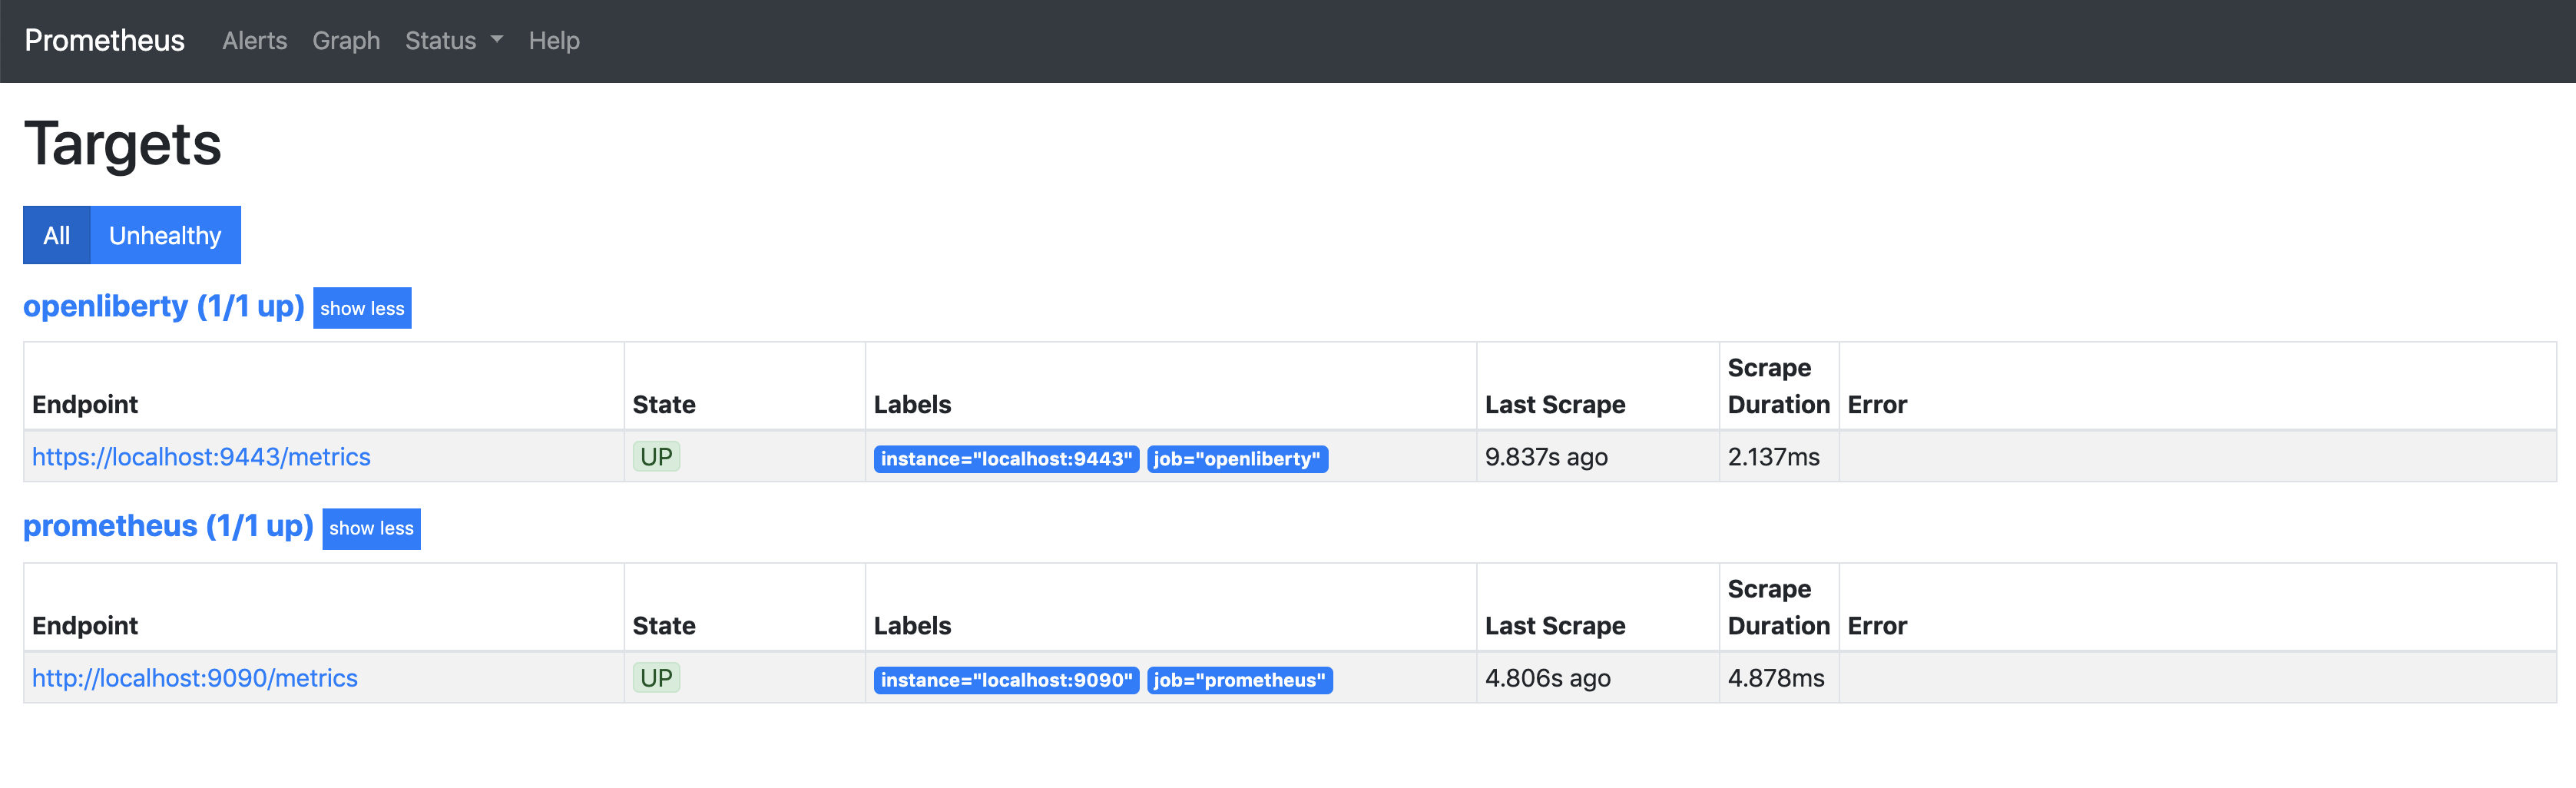
To verify that your setup is working, click on
TargetsunderStatusin the navigation bar. You should see youropenlibertytarget with the statusUP.
You’re now ready to define which metrics you want Prometheus to collect.
Creating Prometheus alerting rules
Create some alerting rules in Prometheus to define which metrics will be received by Prometheus for passing on to Slack.
-
Create a file called
alert.ymlanywhere (take note of the directory, as we will need it later). Inside that file, create some alerting rules, for example:groups: - name: libertyexample rules: - alert: heapUsageTooHigh expr: base_memory_usedHeap_bytes / base_memory_maxHeap_bytes > 0.9 for: 1m labels: severity: warning annotations: summary: "Heap usage is too high" description: "{{ $labels.instance }} heap usage is too high"This rule will send an alert called
heapUsageTooHighwhen the PromQL querybase_memory_usedHeap_bytes / base_memory_maxHeap_bytesis greater than0.9(90%) for one minute. (For testing purposes, feel free to change the threshold to something smaller, like0.05.)If you’re new to PromQL, check out Querying Prometheus.
-
In the
prometheus.ymlfile, add the location of youralert.ymlfile underrule_files. If it’s not in the same directory as Prometheus, make sure you supply the full path. -
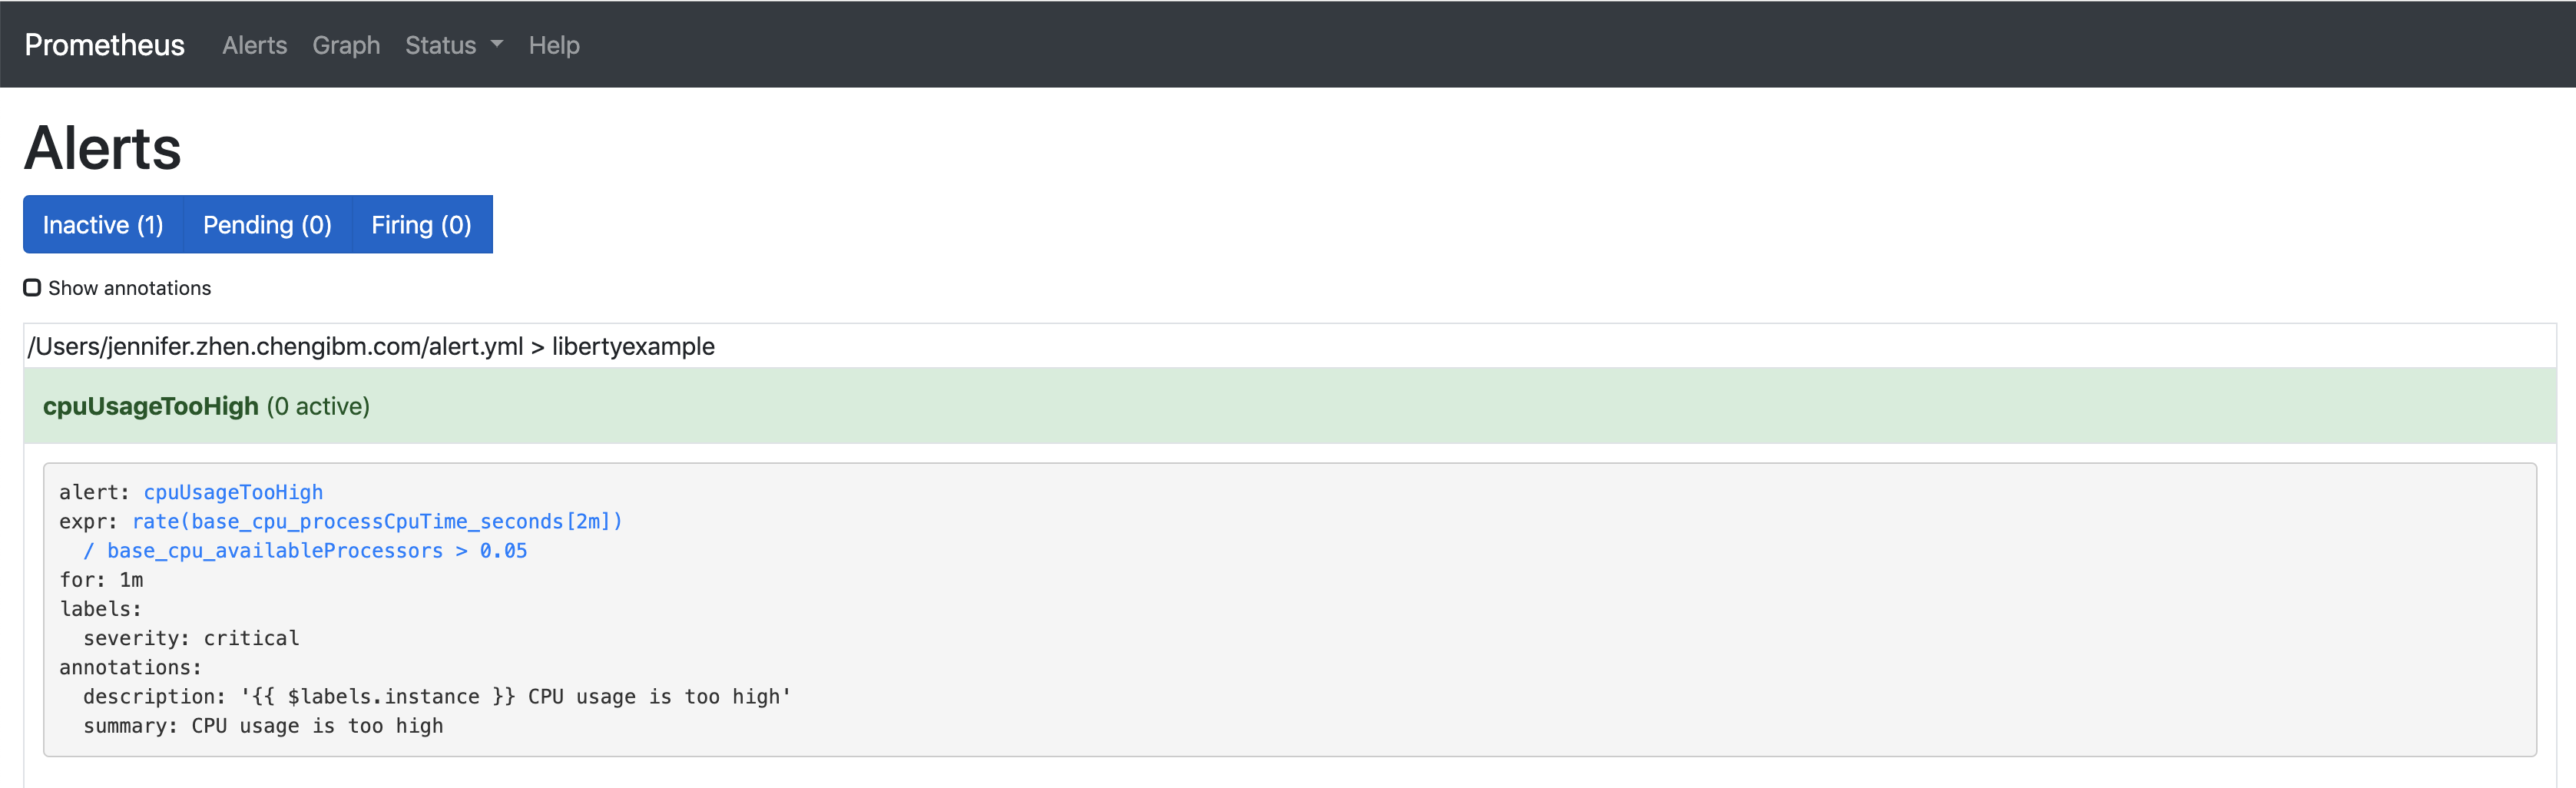
Restart Prometheus. Navigate to
http://localhost:9090and click onAlertson the navigation bar. You should be able to see your alert.
Configure Prometheus Alertmanager to pass alerts to Slack
In this section, you’ll configure the Prometheus Alertmanager to send customized messages to your Slack channel based on the alerting rules we set up earlier.
Configuring the Prometheus Alertmanager to communicate with Slack
Now that Prometheus is set up with rules for our Liberty server, we can set up the Prometheus Alertmanager to connect to Slack.
-
Edit
alertmanager.ymlto add your Slack webhook underglobal.global: slack_api_url: <your api url> -
Under the
route, you will see that there is a receiver calledweb.hook. We will be editing this receiver to work with Slack. Right underwebhook_configs, add another field (aligned withwebhook_configs) calledslack_configs. It’ll look something like this:slack_configs: - channel: 'prometheus-alertmanager-test' title: "{{ range .Alerts }}{{ .Annotations.summary }}\n{{ end }}" text: "*Description*: {{ .CommonAnnotations.description }}\n*Severity*: {{ .CommonLabels.severity }}""The
CommonAnnotationscome from youralert.ymlfile. The text is written using the Go templating system. -
Run
./alertmanager.If you’re running Alertmanager locally and run into an error, try running the command with an additional parameter:
./alertmanager --cluster.listen-address=""
The Alertmanager is located at http://localhost:9093 by default. Since we haven’t generated any test data yet, you won’t see any alert groups at the moment. We’ll do that next.
Receiving alerts via Prometheus Alertmanager
Now that Alertmanager is set up, we need to configure Prometheus to talk to it.
-
In the
prometheus.ymlfile inside your Prometheus folder, addlocalhost:9093to the targets under the Alertmanager configuration:# Alertmanager configuration alerting: alertmanagers: - static_configs: - targets: - localhost:9093 -
Restart Prometheus.
-
Trigger the alert however you can. With the rule we’re using, the easiest way is to change your threshold value to be very low and run your application a few times to use up some of your heap.
-
Head over to
http://localhost:9090and click on Alerts. Your alert should be in thePendingorFiringstate. Once the alert is in theFiringstate, you should also be able to see your alert athttp://localhost:9093. -
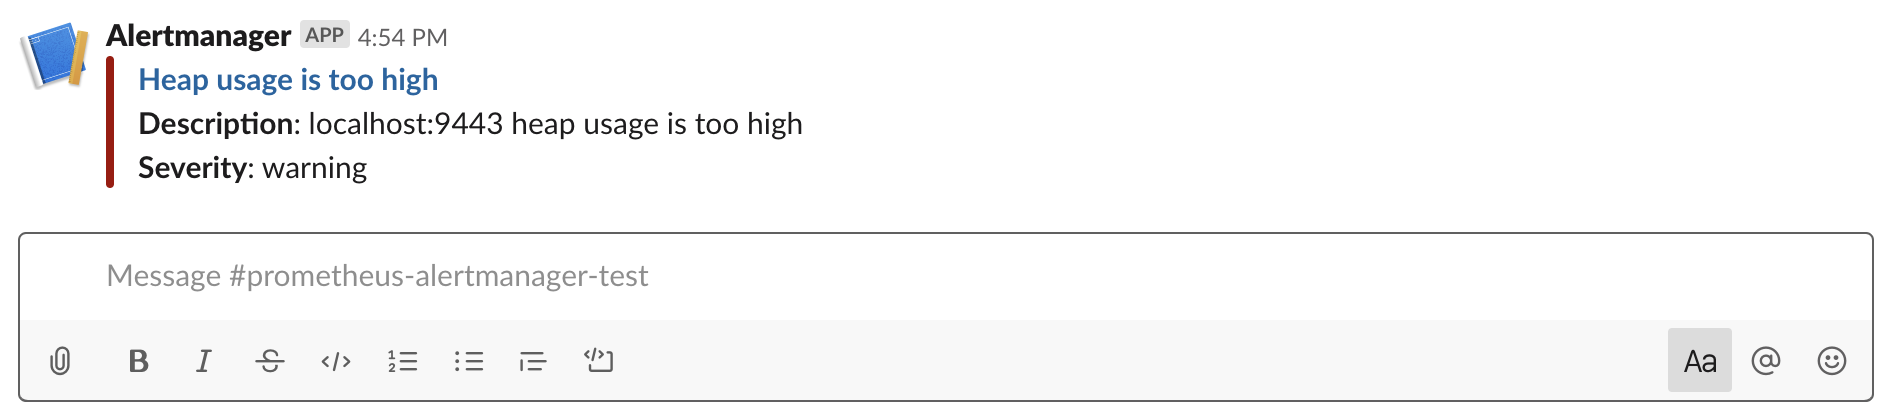
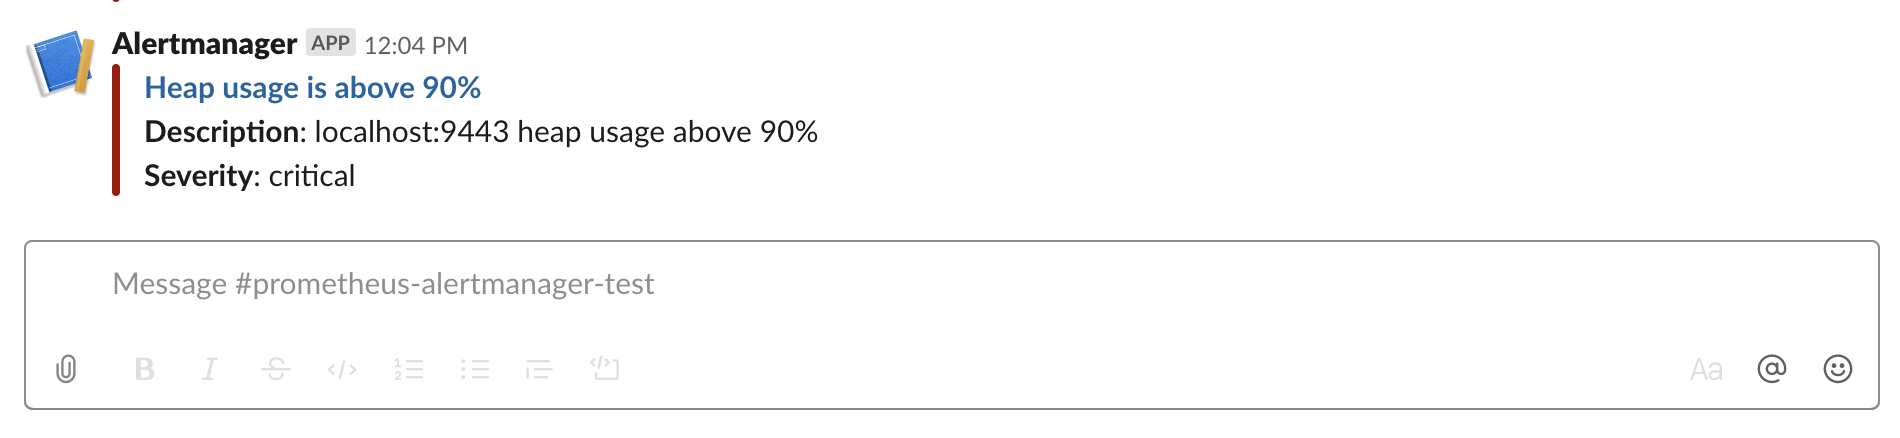
Check your Slack channel to see your message.
Additional tips for when you’re creating larger alerting systems
When creating larger alerting systems, it’s crucial to keep your alerts organized so that you can respond quickly to any problems. You can configure your Alertmanager to group certain alerts together using groups, to send alerts to different locations using routes, and to only send useful alerts (while not compromising coverage of your data) with inhibition.
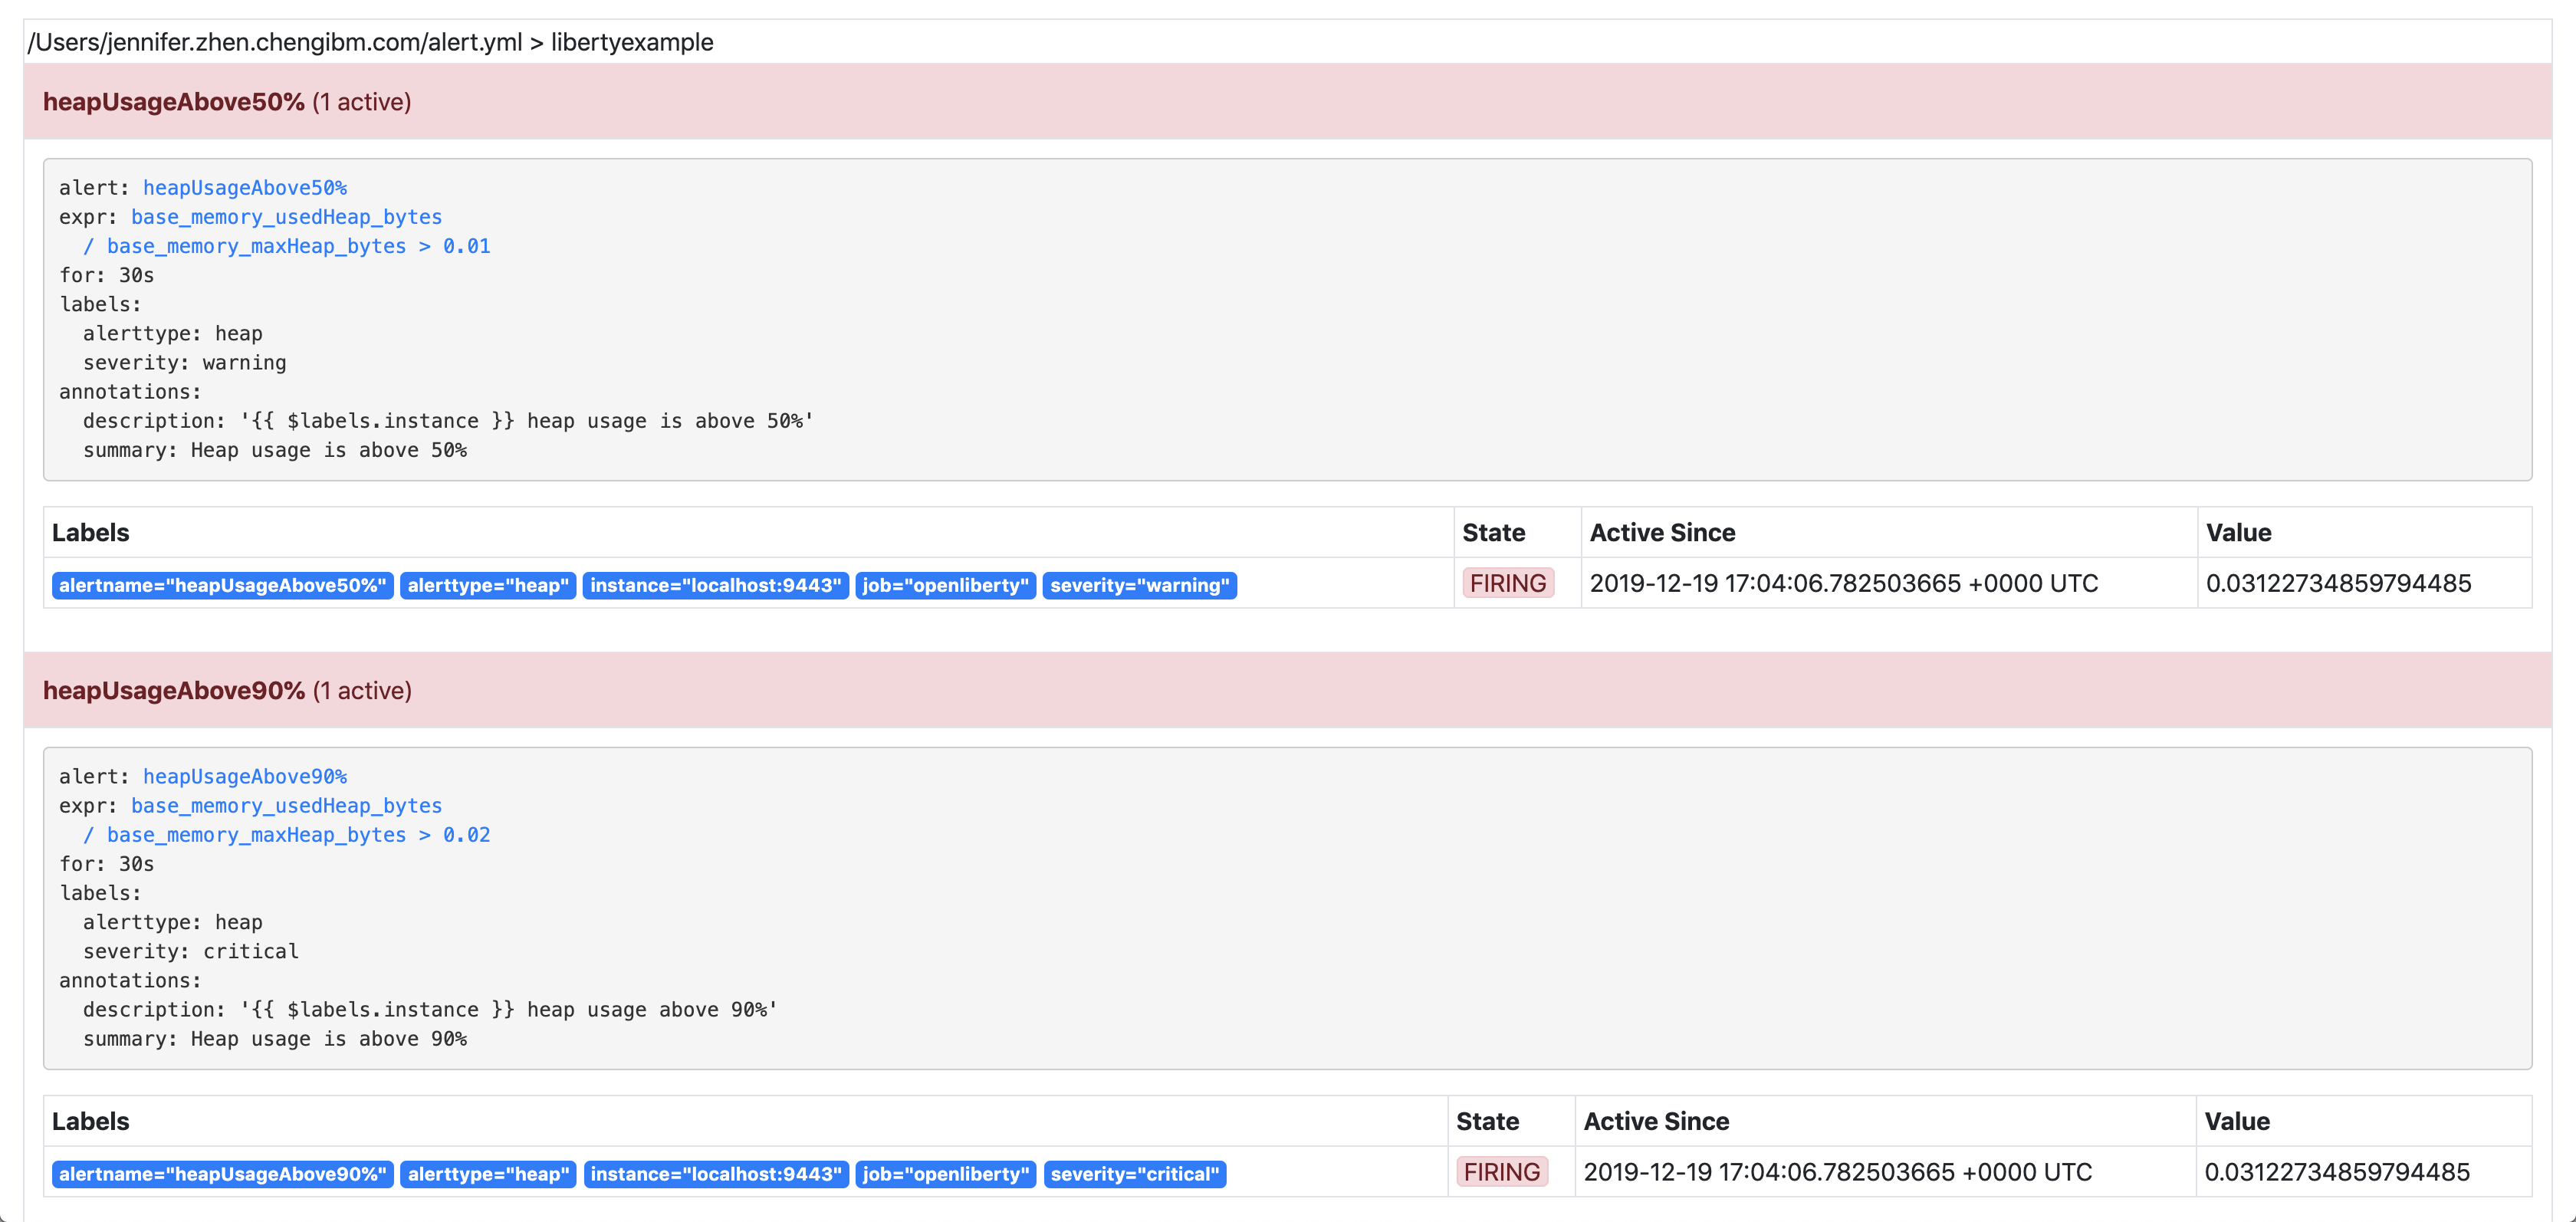
If you want to test these configurations out yourself, you’ll need to have a couple of rules to play with. To your rule file, alert.yml, add the following rules:
- alert: heapUsageAbove90%
  expr: base_memory_usedHeap_bytes / base_memory_maxHeap_bytes > 0.9
  for: 30s
  labels:
    alerttype: heap
    severity: critical
  annotations:
    summary: "Heap usage is above 90%"
    description: "{{ $labels.instance }} heap usage above 90%"
- alert: heapUsageAbove50%
  expr: base_memory_usedHeap_bytes / base_memory_maxHeap_bytes > 0.5
  for: 30s
  labels:
    alerttype: heap
    severity: warning
  annotations:
    summary: "Heap usage is above 50%"
    description: "{{ $labels.instance }} heap usage is above 50%"
If your alert.yml file still has the old rule heapUsageTooHigh, you can delete that one. For testing purposes, you can change the thresholds to be much smaller (0.02 and 0.01, for example, are what we used to test with.)
Routes
There’s a time and a place for everything, and that includes alerts. Routing your alerts allows you to use multiple different receivers based on the label assigned to each rule.
For example, if you wanted to use PagerDuty to page critical alerts, and use Slack to send notifications of warning alerts, you can set the route to look like the following in alertmanager.yml:
# The root route. This route is used as the default
# if there are no matches in the child routes.
route:
  group_wait: 10s
  group_interval: 10s
  repeat_interval: 5m
  receiver: 'default_receiver'
  # A child route - all critical alerts follow this route
  # and use the receiver 'pager_receiver'
  routes:
  - match:
      # This can be any label or annotation
      severity: critical
    receiver: pager_receiver
    repeat_interval: 30m
And set up a new receiver for PagerDuty by adding this to receivers:
- name: pager-receiver
  pagerduty_configs:
  - service_key: <your service key>
Now, your alerts will be routed to different locations depending on the severity.
Groups
If you have a network of systems that goes down, you probably don’t want to receive an alert for every single instance - instead, it’d be preferable to get one alert that encapsulates all the other ones.
In your alertmanager.yml, under route, you can group your alerts by label name:
route:
group_by: [ alerttype ]
group_wait: 10s
group_interval: 10s
repeat_interval: 5m
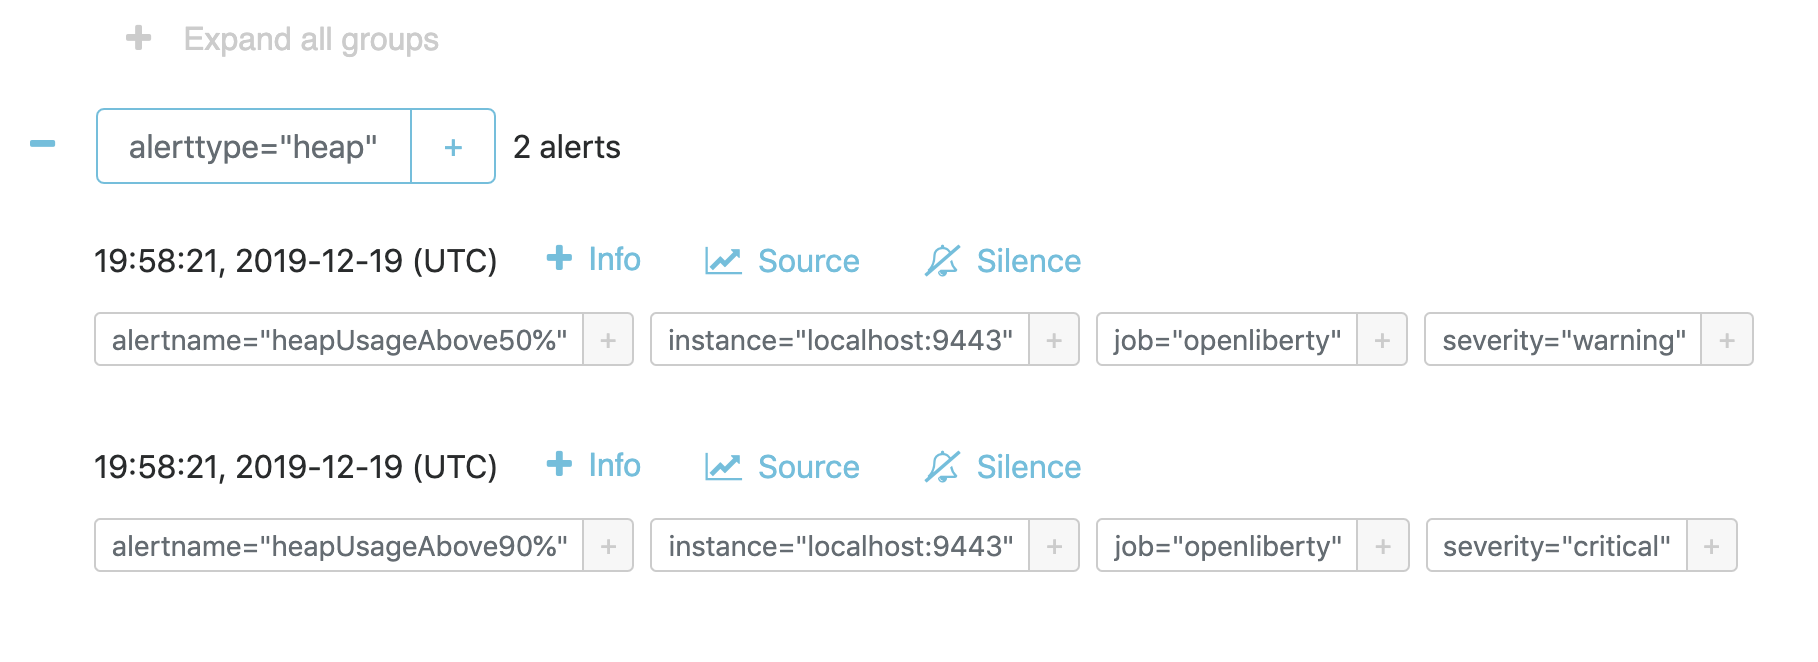
receiver: 'default_receiver'The alerts will be grouped by alerttype, and the group will only send one alert with all of the information.
Inhibition
For scenarios where you have multiple alerts that convey the same information, inhibiting your alerts can be useful. For example, if you have one alert that detects when 50% of your memory heap is used, and another alert for 90% of memory heap being used, there’s no reason to send out alerts for the 50% problem.
In your alertmanager.yml, add the following under inhibition_rules:
- source_match:
    severity: 'critical'
  # The alert that gets muted
  target_match:
    severity: 'warning'
  # Both source and target need to have the same value to inhibit the alert
  equal: [ 'alerttype' ]
The alert that has the label severity: warning (the target) will not be sent if there is an alert with the label severity: critical (the source). Both alerts must have the same value for the label alerttype. In our scenario, the alert heapUsageAbove50% will be inhibited if heapUsageAbove90% is firing at the same time.
If we change the alerttype to be different values, the inhibition rule no longer matches, and both alerts will be sent. You can try it out by making the two alerttype labels different.
Silencing alerts
Sometimes, you need to temporarily stop receiving alerts. For example, if you need to take your server down temporarily for maintenance, you don’t want to receive any false positives. To do that, you can silence your alerts in the Alertmanager UI, under the Silences tab:
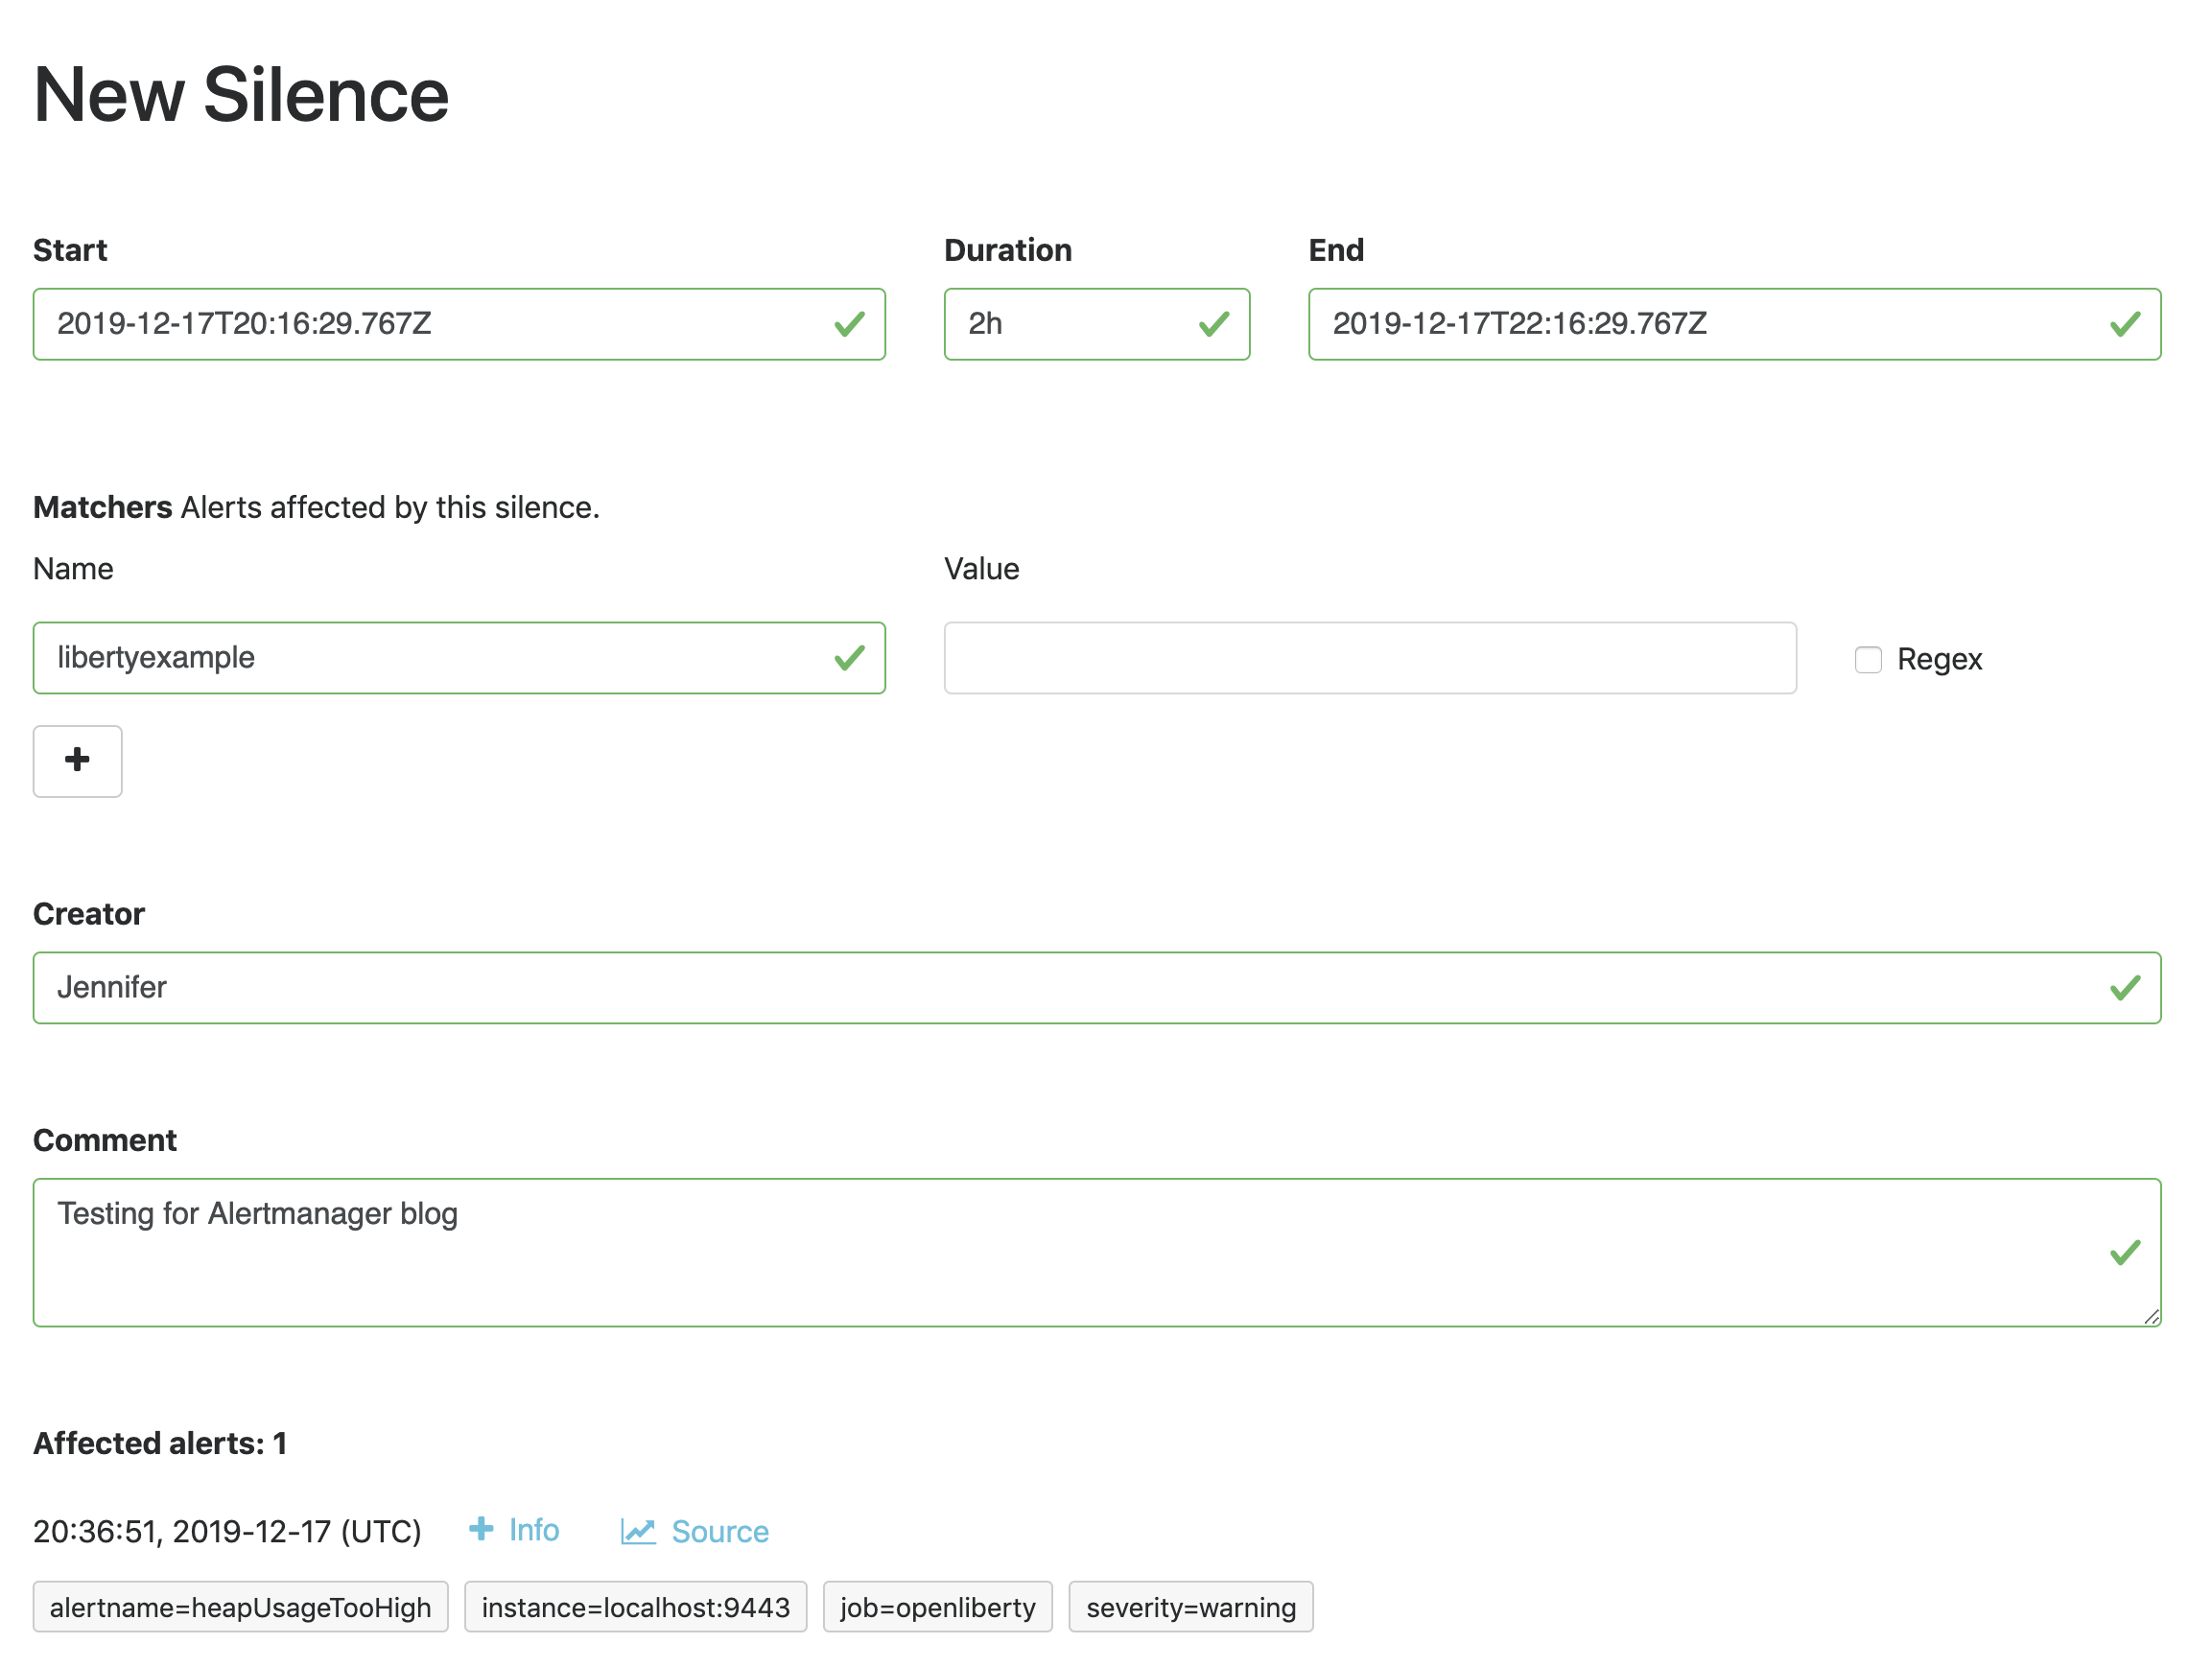
The matchers can be any metadata from your rules, e.g. labels, annotations, rule group name, etc.
Next steps
Now that you have a basic configuration of the Prometheus Alertmanager set up, you can play with Prometheus rules to create a more comprehensive alerting system. You can also customize the messages to be more informative by using the Go templating system.
Need some inspiration? Take a look at our sample configuration for Open Liberty.


