New Kibana dashboard visualizations to spot potential problems in your Liberty servers


Log aggregation and analysis are essential in order to monitor and quickly troubleshoot problems in your server. You can use the popular Elastic Stack tools to aggregate and analyze the log events then display those log events in dashboards such as Kibana to help you spot potential problems in your Liberty server in real time. We have added new visualizations to our sample Kibana dashboards to help you.
We created some sample Kibana dashboards that you can download from GitHub. A dashboard is a collection of visualizations and provides real-time information at a glance. There are four sample dashboards available. Which dashboards you use depends on how you collect your log events data and what you want to visualize. All four of the sample dashboards are available to use with logging data collected by the Liberty Logstash Collector feature (logstashCollector-1.0), and three of the dashboards can be used with logging data collected from JSON logging in Liberty. Each dashboard specializes in visualising one or more types of log events: audit, garbageCollection, message, trace, FFDC, and accessLog.
Displaying Liberty logging data from Logstash Collector in Kibana dashboards
To set up the Elastic Stack with Logstash Collector version 1.0, follow the instructions in Using the Logstash collector version 1.0 in the Liberty Knowledge Center.
Get the sample dashboards for use with logging data from Logstash Collector from GitHub.
Displaying Liberty logging data from JSON logging in Kibana dashboards
To set up the Elastic Stack with JSON logging, follow the instructions in Analyzing logs with Elastic Stack in the Liberty Knowledge Center.
Get the sample dashboards for use with logging data from JSON logging from GitHub.
New visualizations in the sample Kibana dashboards
The four sample dashboards available on GitHub are:
-
Audit (Logstash Collector and JSON logging data)
-
Memory (Logstash Collector data only)
-
Problems (Logstash Collector and JSON logging data)
-
Traffic (Logstash Collector and JSON logging data)
We have improved the Memory, Problems, and Traffic dashboards by providing new visualizations so that you can immediately see possible errors occurring in your Liberty servers.
Memory dashboard (Logstash Collector data only)
The Memory dashboard visualizes the garbage collection duration and JVM heap usage information. Garbage collection data is only available from Liberty servers running on an IBM JDK. To use the dashboard, configure your Liberty logstashCollector feature to use the garbageCollection source.
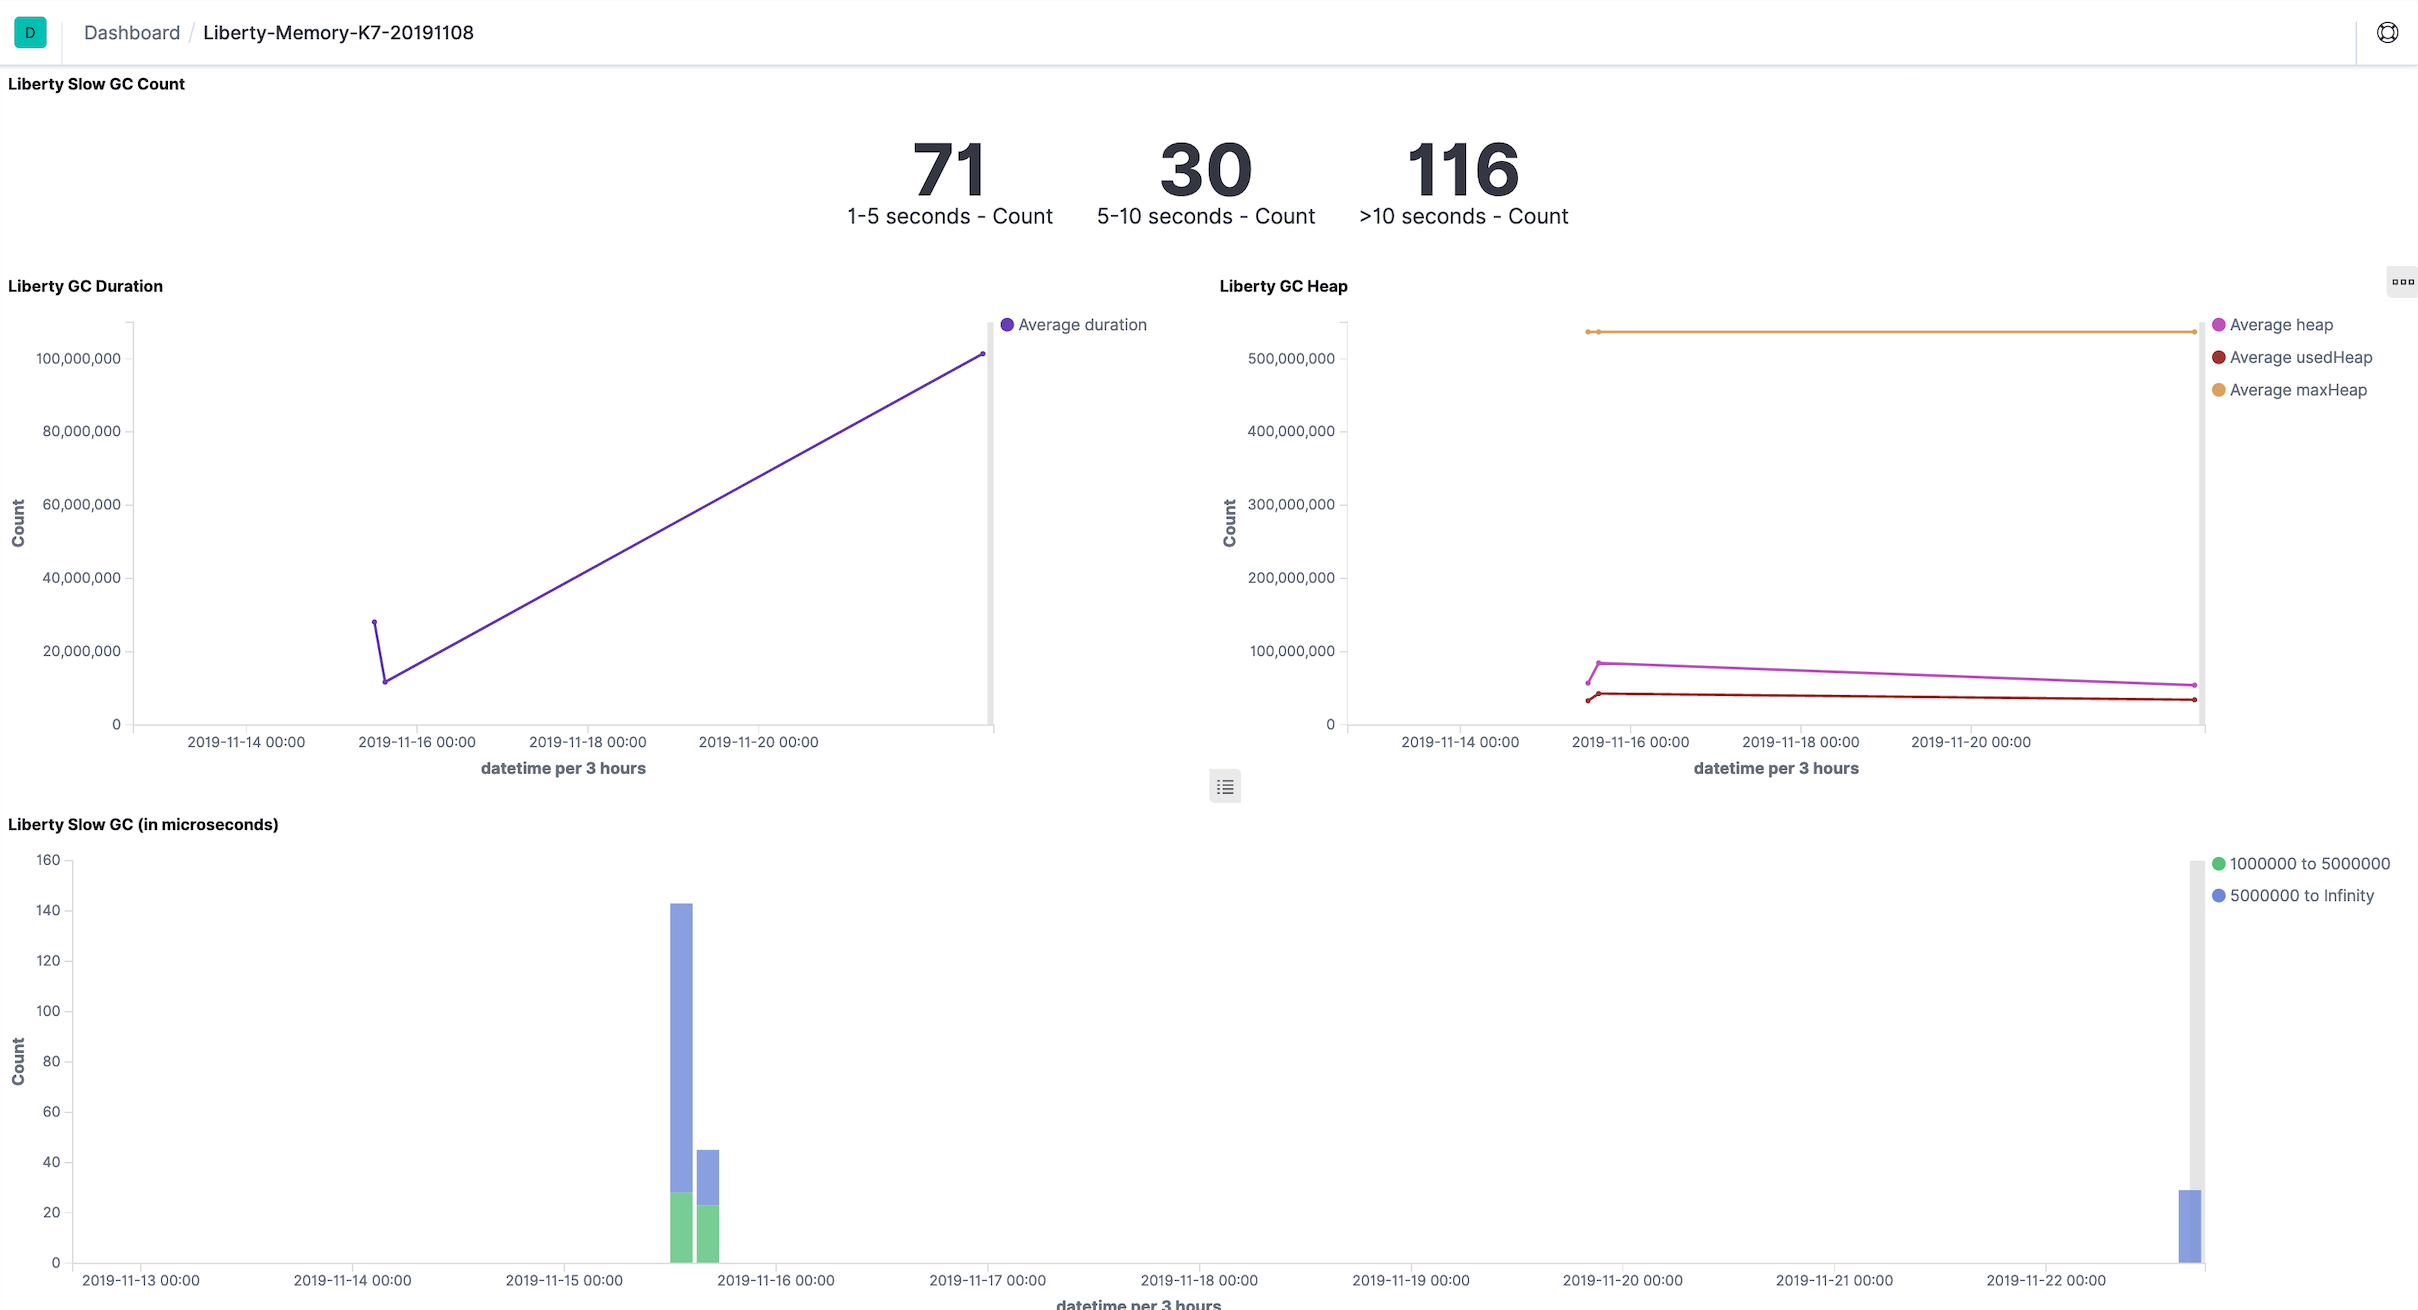
The Memory dashboard using the Logstash Collector feature has two new visualizations: Liberty Slow GC and Liberty Slow GC Count, which respectively allow you to view when garbage collection is occurring, and the counts of garbage collection times ranging from 1 to 5 seconds, 5 to 10 seconds, and greater than 10 seconds. This allows you to easily see whether or not your Liberty Server garbage collection is slow overall, and when slower garbage collection is happening during your server’s runtime.
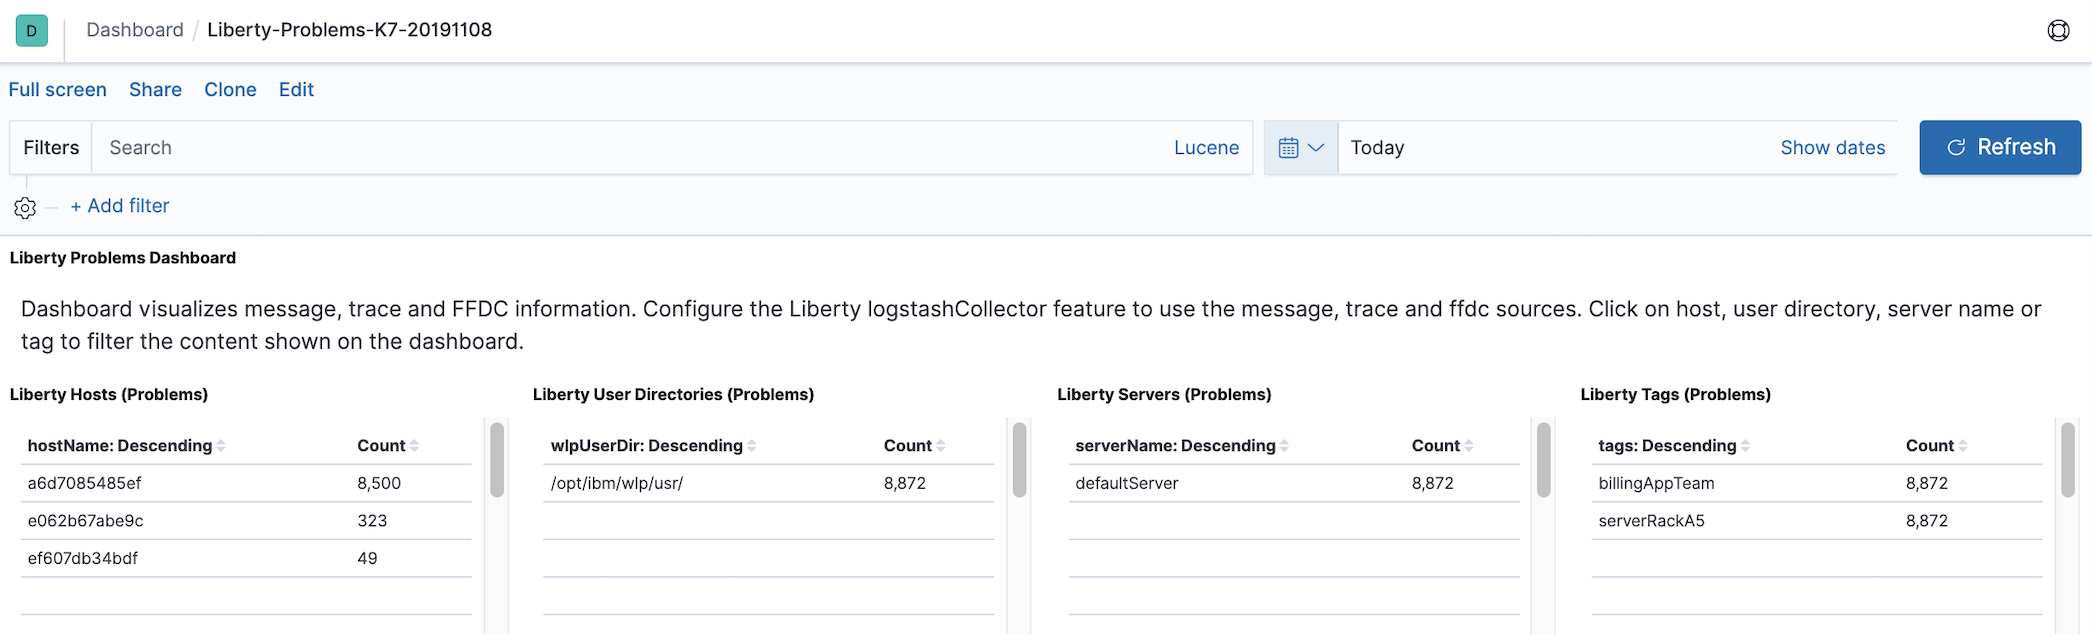
Problems dashboard
The Problems dashboard visualizes message, trace, and FFDC information. To use the dashboard, configure your Liberty server to use JSON logging or the logstashCollector feature with the message, trace, and ffdc sources.
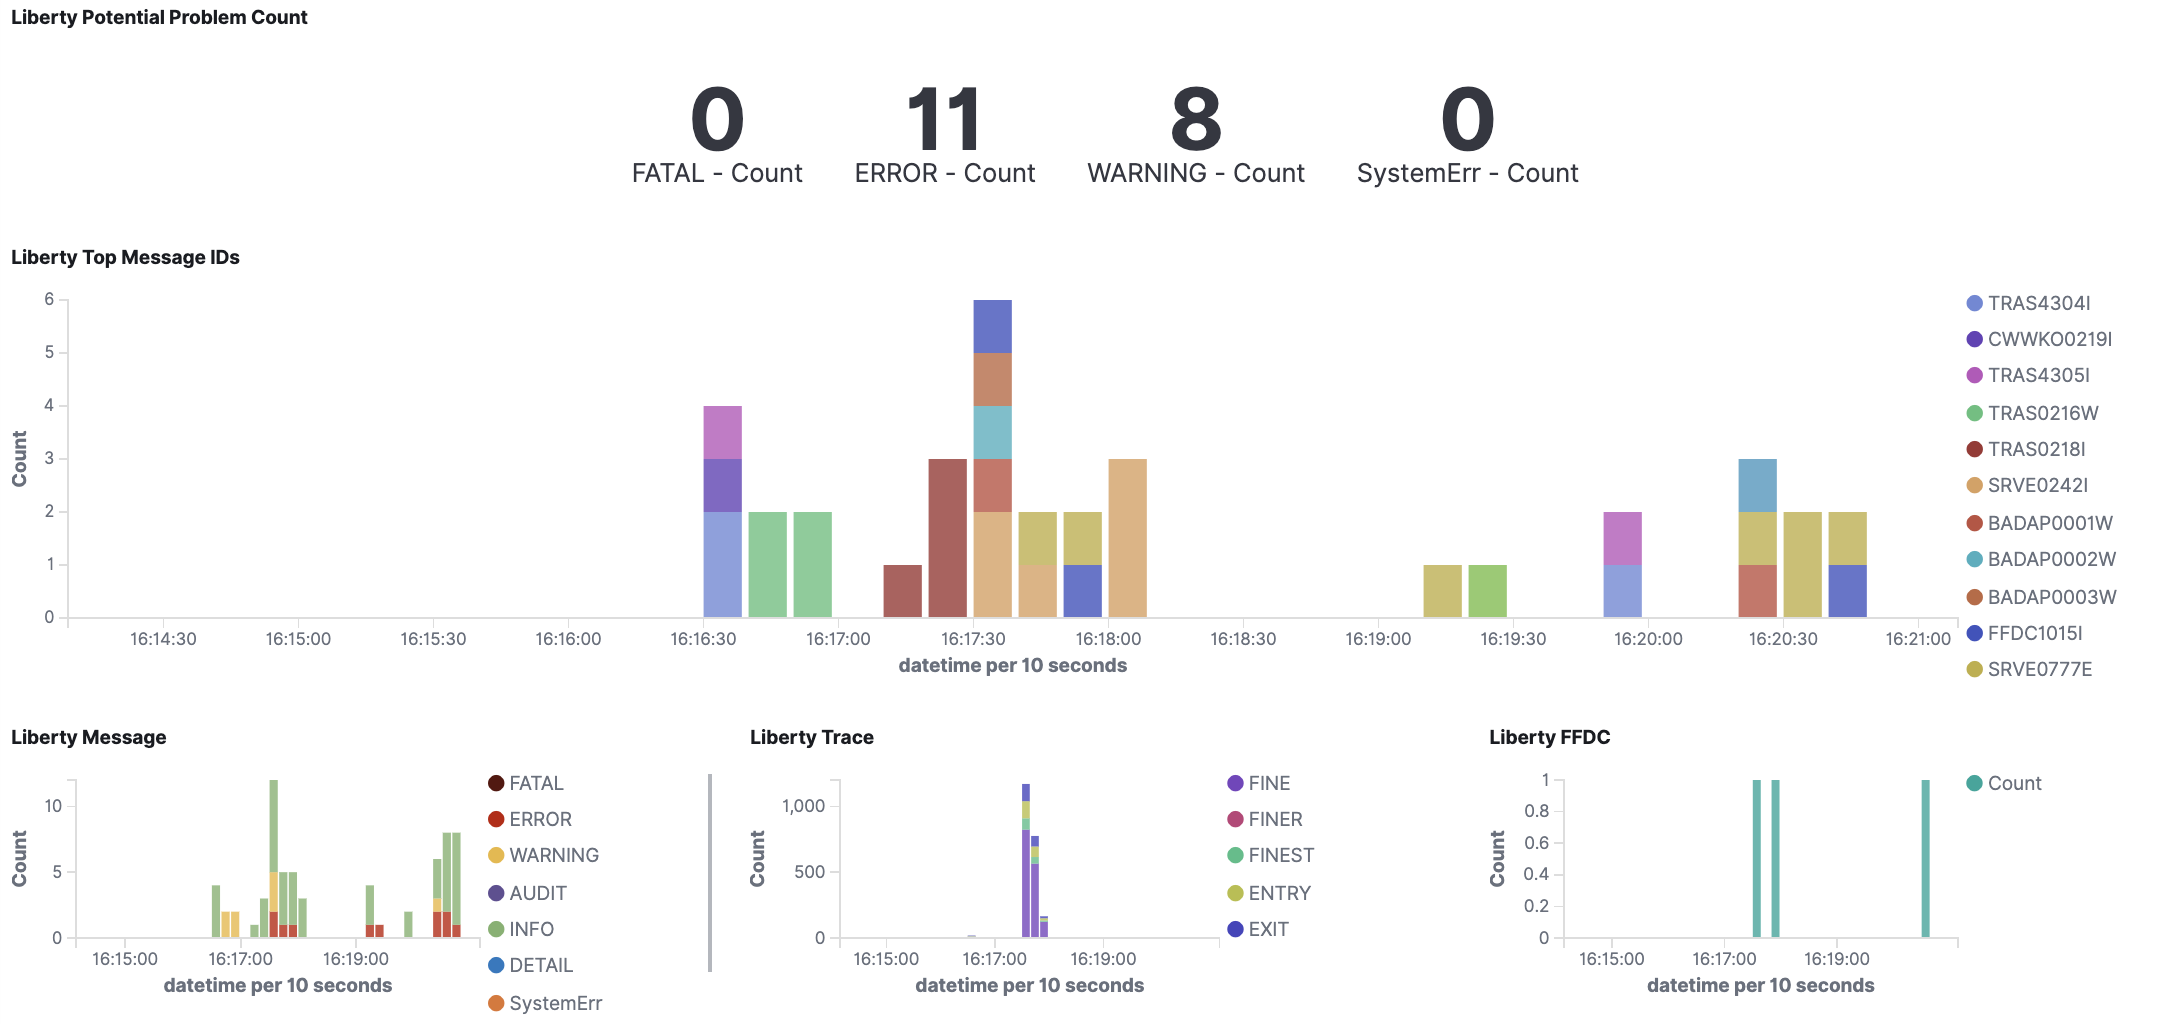
The Problems dashboard includes a new visualization, Liberty Potential Problem Count, which displays the counts of problematic logs in order of log level/severity. The numbers make it easy to see at a glance how many potential problem log entries have been collected. Both Liberty Message and Liberty Trace graphs are broken down by log levels/severity and you can easily see when problems occurred. Click on any of the severities in the legend to add a filter.
Traffic dashboard
The Traffic dashboard visualizes access logging information. To use the dashboard, configure your Liberty server to use JSON logging or the logstashCollector feature with the accessLog source.
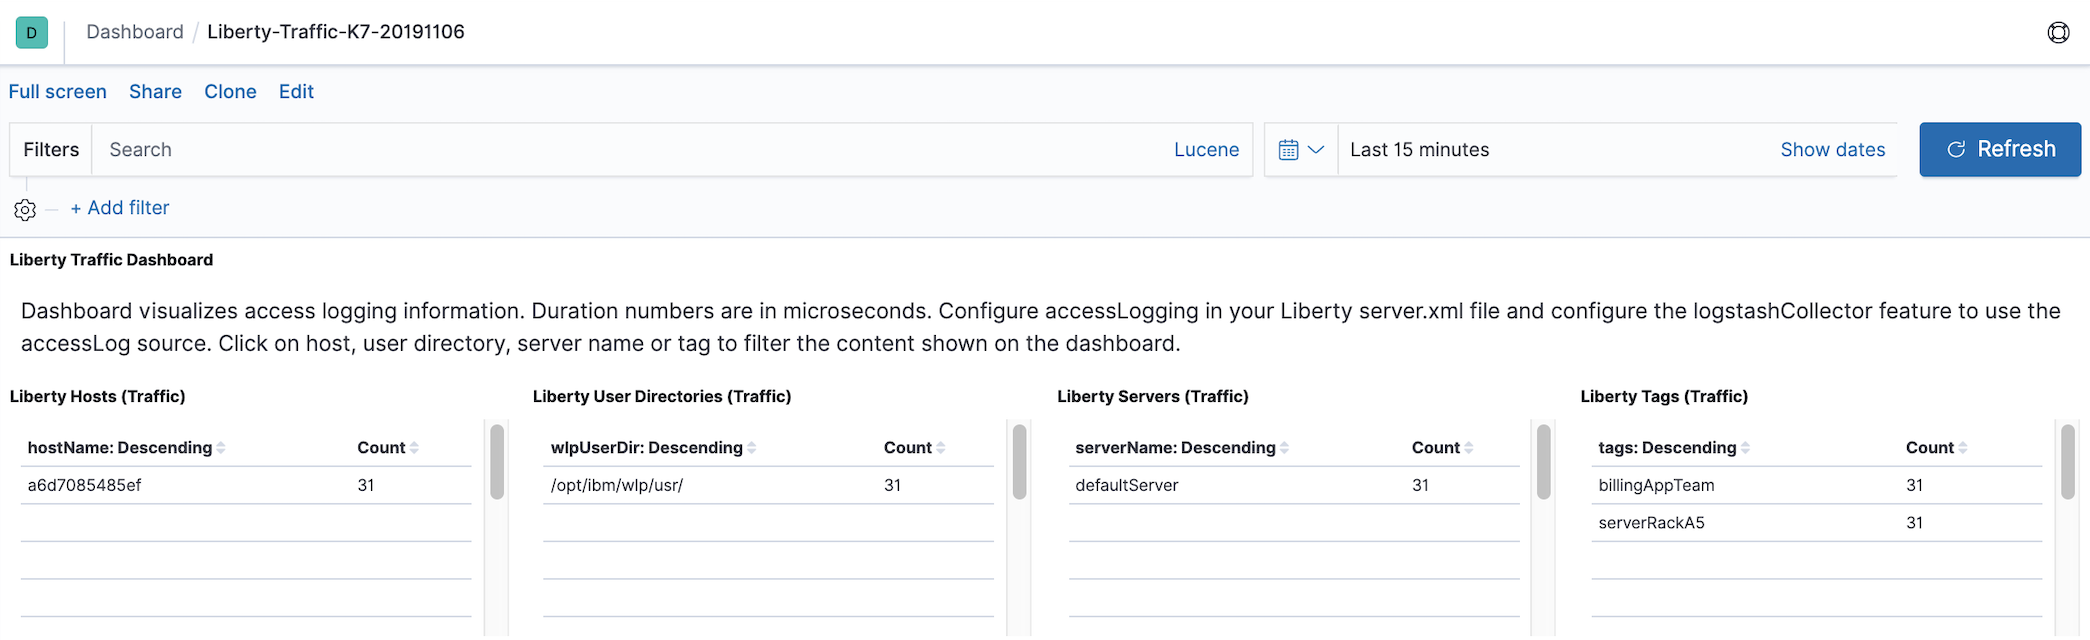
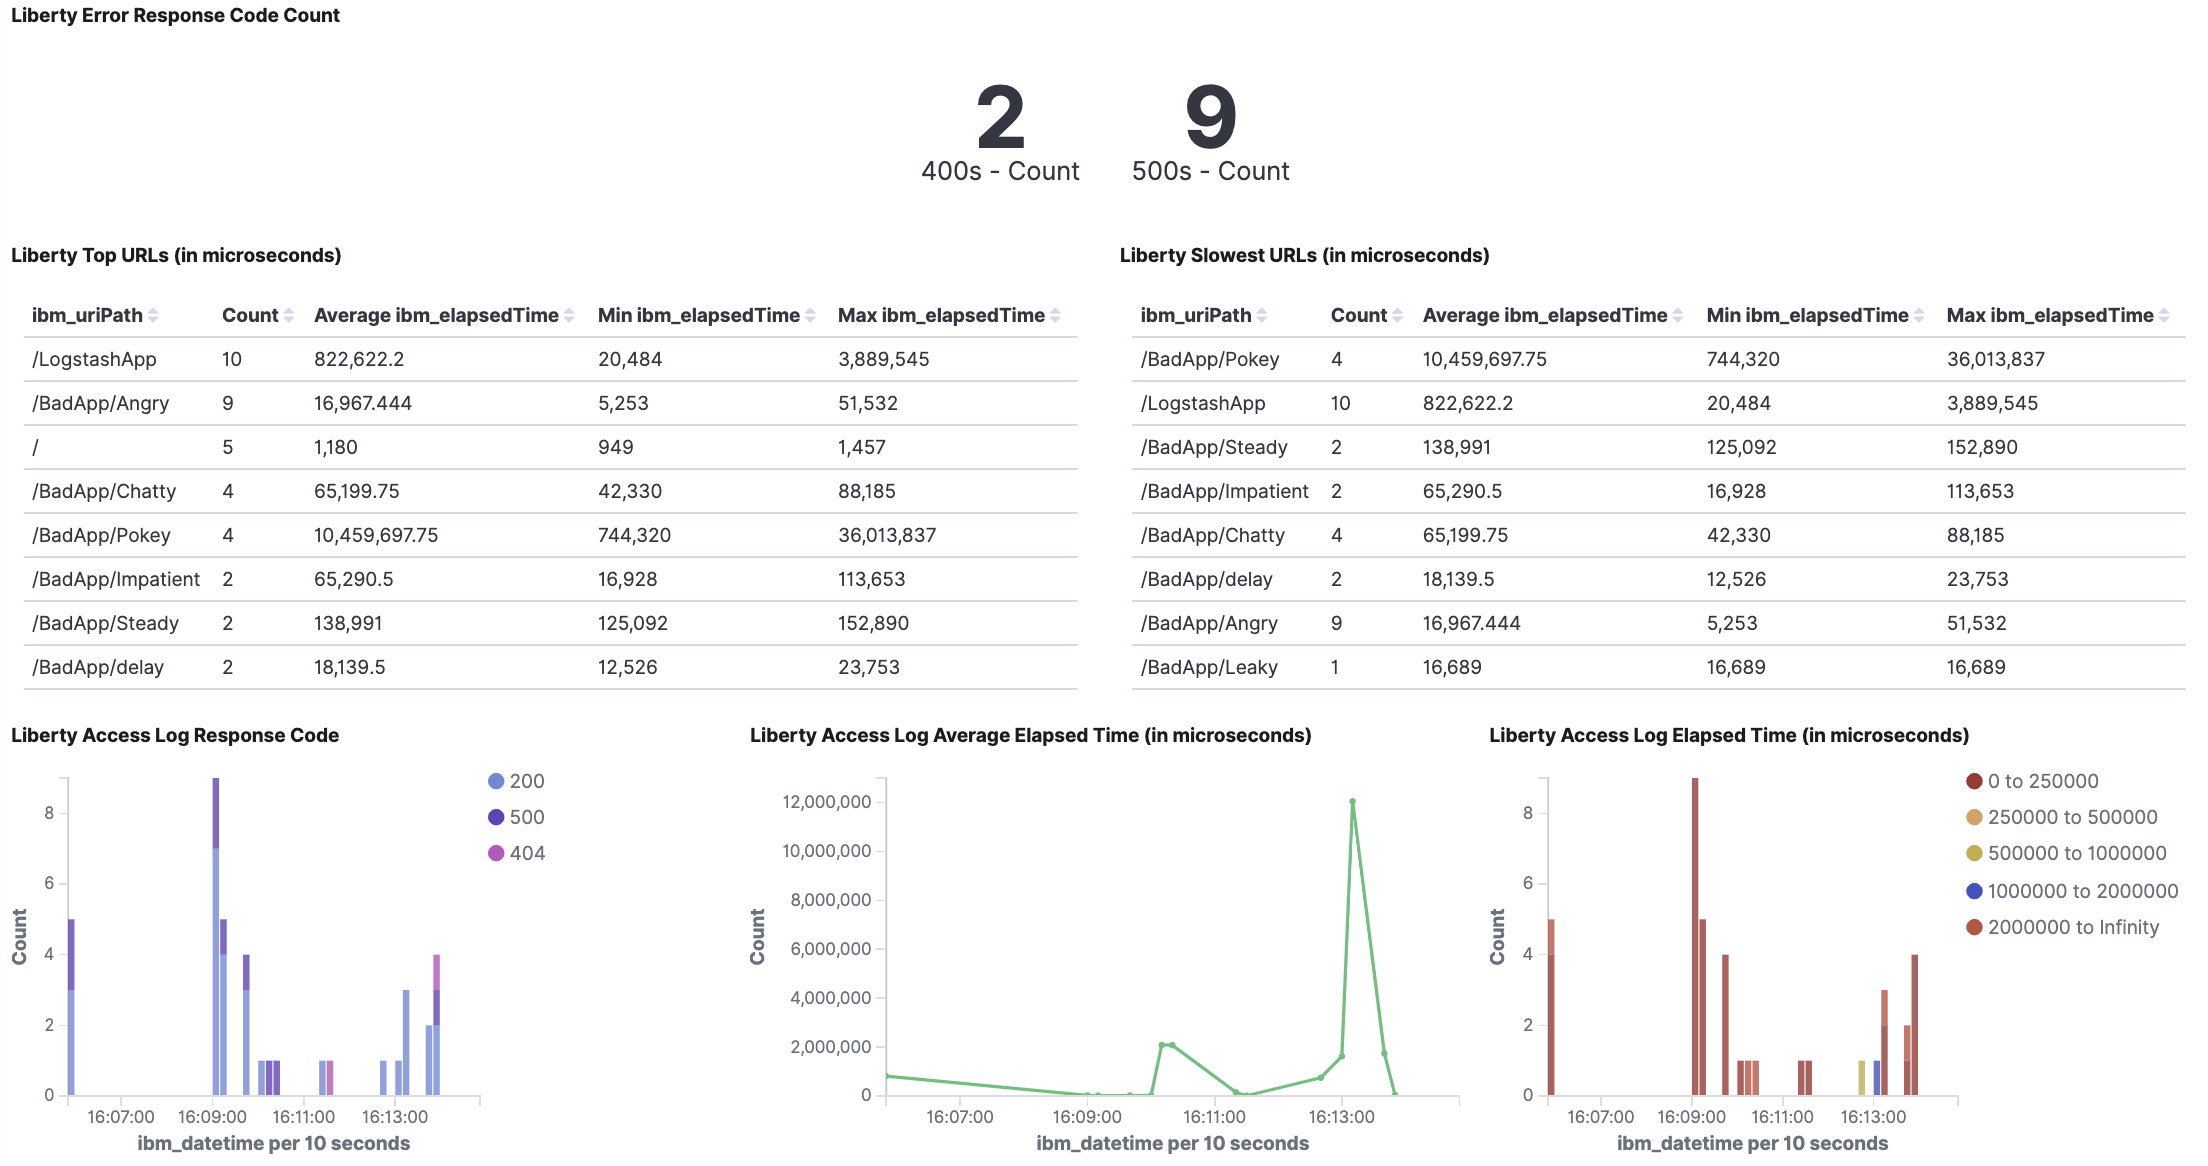
The Traffic dashboard features a new visualization, Liberty Error Response Code Count, which displays the count of 400s and 500s response codes. This allows you to easily see if your Liberty Server is encountering any errors in your accessed endpoints.
Conclusion
For all of the sample dashboards, you can filter log information as needed. By using Kibana dashboards with JSON logging or the Logstash Collector feature, you can easily see how healthy and well-performing your Liberty servers are.
Take a look at this recent webinar on using Liberty with Elastic Stack (ELK) and the sample dashboards.


